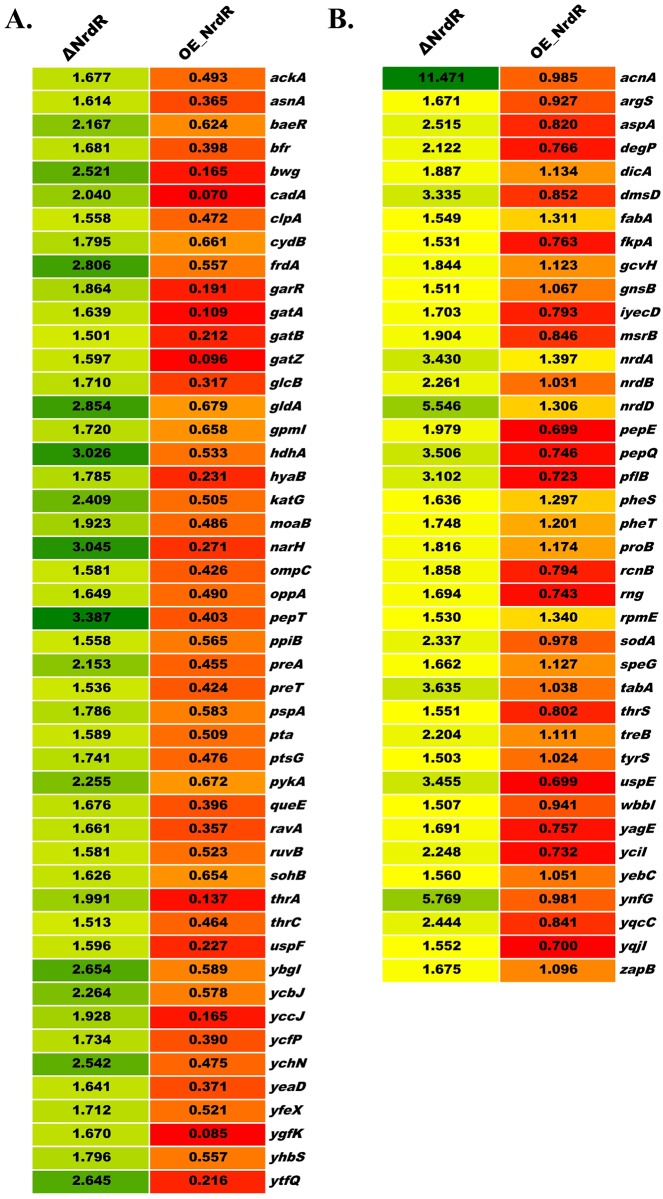
Fig 5. Heat maps representing differential regulation of proteins in E. coli following NrdR-deletion and -overexpression.
(A) Protein categories upregulated in the ΔNrdR strain but downregulated in the OE-NrdR strain. (B) Protein categories upregulated in the ΔNrdR strain but with no change for the OE-NrdR strain. The color scale indicates differential regulation of protein amounts relative to WT E. coli control, with upregulation indicated by green shading and downregulation by red. Genes are listed alphabetically.

