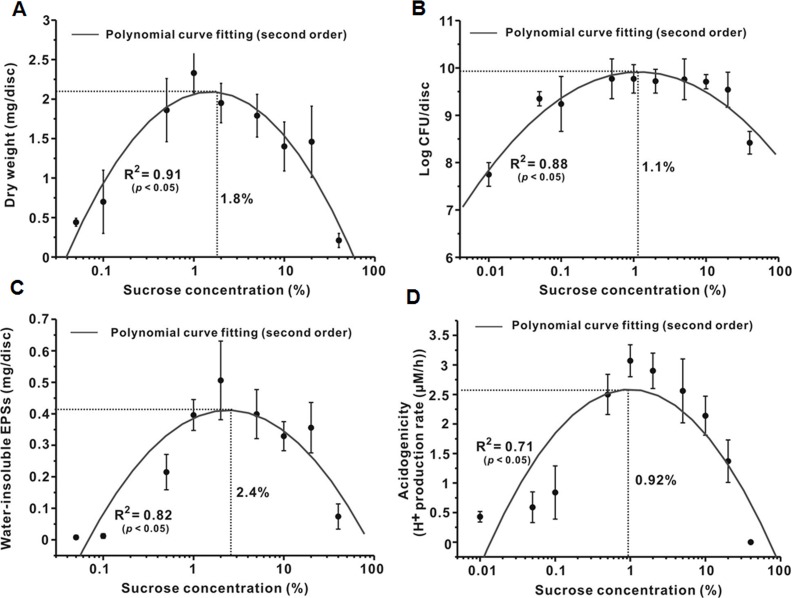
Fig 2. Relationship between sucrose concentration and S. mutans biofilm formation.
(A) Dry weight. (B) Bacterial viability. (C) Water-insoluble EPSs. (D) Acidogenicity. In A and C, the dry weight and amount of water-insoluble EPSs at 0% were not detected. In B and D, since x coordinates are plotted on a logarithmic scale, and since the log of 0 is undefined, we approximated 0 with an x coordinate of 0.01.

