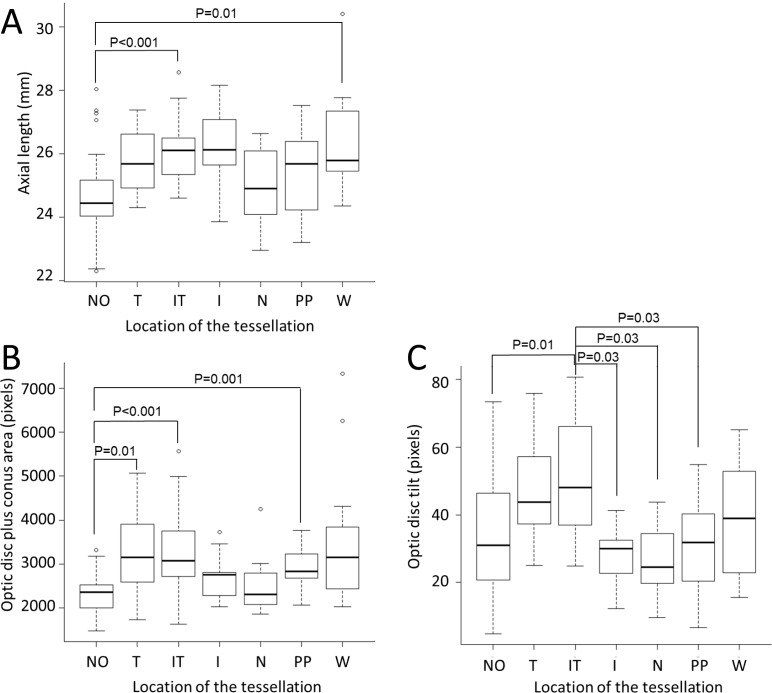
Fig 2. Multiple comparisons of the axial length, area of optic disc plus conus, and optic disc tilt among groups.
(A) The AL of the IT group (P <0.001) and W group (P = 0.01) were significantly longer than that in the NO tessellation group. (B) The area of the optic disc plus conus in the T group (P = 0.01), IT group (P <0.001), and PP group (P = 0.001) were significantly larger than that in the NO tessellation group. (C)The optic disc tilt in the IT group was significantly larger than that in the NO group (P = 0.01), the I group (P = 0.03), the N group (P = 0.03), and the PP group (P = 0.03).

