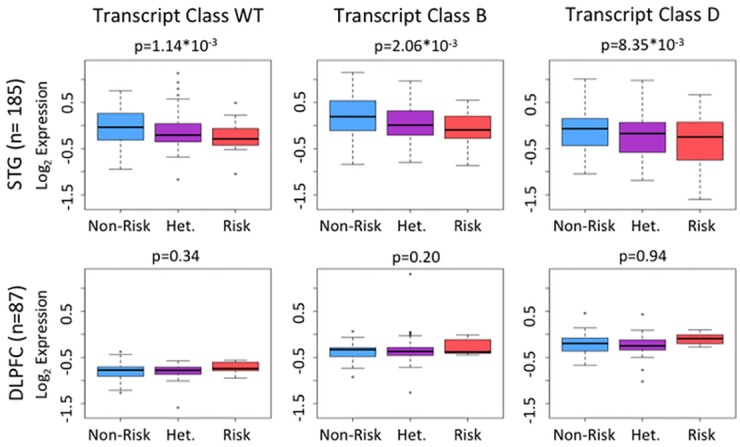
Fig 1. Log transformed expression of the three CACNA1C transcript classes.

CACNA1C transcripts are measured by qPCR and grouped by genotype at rs1006737. Samples homozygous for the non-risk allele (GG) are shown in blue, heterozygous (GA) in purple, and homozygous for the risk allele (AA) in red. Samples from the STG in the top row, and DLPFC in the bottom row. Regression p-values for effects of genotype are shown over each graph.
