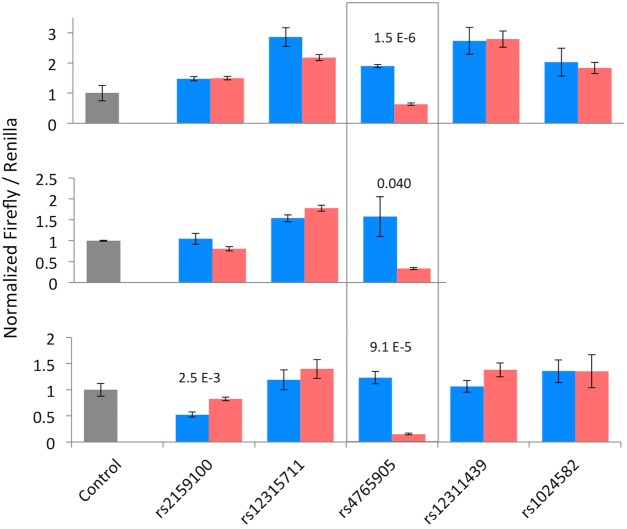
Fig 2. A subset of DLR constructs transfected in SK-N-SH cells.
The top panel shows the same data from S2 Fig, and each successive panel shows data from replicate experiments. Relative firefly luciferase activity is shown as an average of four independent DNA extractions for each allele. Error bars represent standard error. Non-risk allele is shown in blue, risk allele is in red. Significant differences between the two alleles of a construct are indicated as p-values above the pair.

