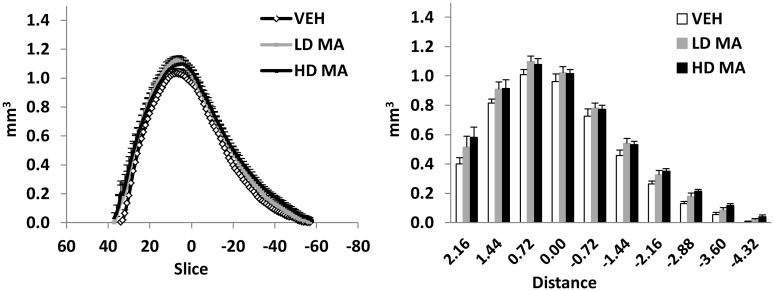
Fig 3. Volume of the striatum along the antroposterior axis.
A Average volume of each MRI slice along the anteroposterior axis, from the three treatment groups. B Average volume of consecutive segments of the striatum, 720um each (9 slices), along the anteroposterior axis. The points and bars represent mean + S.E.M. Zero on the X axis corresponds to the posterior part of the anterior commissure. Distance is in mm.

