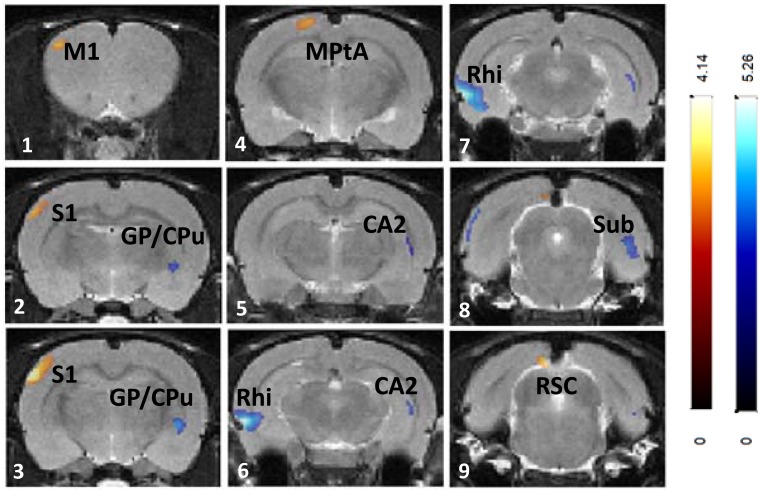
Fig 7. Effects of chronic HD MA (8mg/kg) treatment on regional brain glucose metabolism.
Changes in regional brain glucose metabolism are superimposed on the Schweinhardt MRI template, in Paxinos space. Red: brain regions with increased glucose metabolism after 8mg/kg MA treatment compared with vehicle treatment; Blue: brain regions with decreased glucose metabolism after MA 8mg/kg treatment compared with vehicle treatment. M1: primary motor cortex; S1: primary somatosensory cortex; CPu: caudate-putamen (striatum); GP: globus pallidus; PtA: parietal association area; CA1: cornu ammonis 2 (hippocampus); Rhi: rhinal cortices; Sub: subiculum; RCS: retrosplenial cortex.

