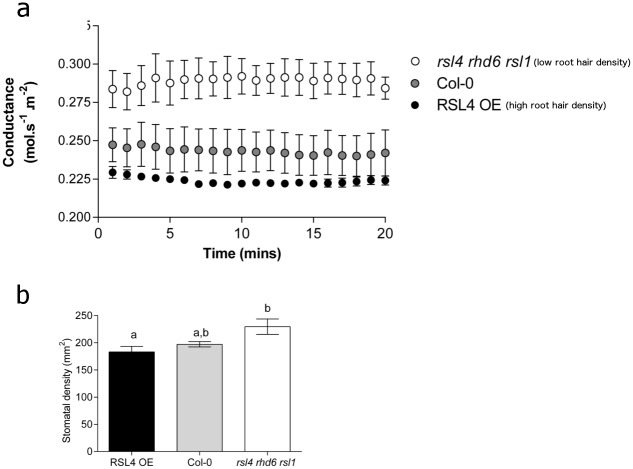
Fig 3. Plants with altered root hair density and length display correspondingly opposite alterations in stomatal conductance and stomatal density.
(A) Mean steady state stomatal conductance rates for genotypes with decreased (rsl4rhd6rsl1; white symbols), or increased root hair length and density (RSL4OE; black symbols) in comparison to controls (Col-0; grey symbols) at 1000 μmol.s-1m-2 light, 400 ppm CO2 over 20 minutes. (B) Mature leaf abaxial stomatal densities of RSL4 overexpression or rsl4rhd6rs1 genotypes. Bars with no letters in common are significantly different, P<0.05, (Tukeys test after one-way ANOVA). Error bars represent SE.

