
Fig 5. Total grooming frequency and HCC following H1’s removal.
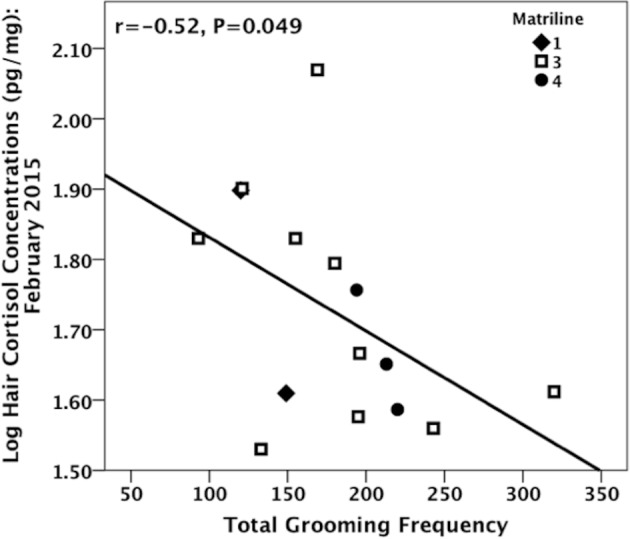
Frequency represents total number of intervals grooming occurred from August to February (when the HCC samples were taken).
Official websites use .gov
A
.gov website belongs to an official
government organization in the United States.
Secure .gov websites use HTTPS
A lock (
) or https:// means you've safely
connected to the .gov website. Share sensitive
information only on official, secure websites.
Frequency represents total number of intervals grooming occurred from August to February (when the HCC samples were taken).