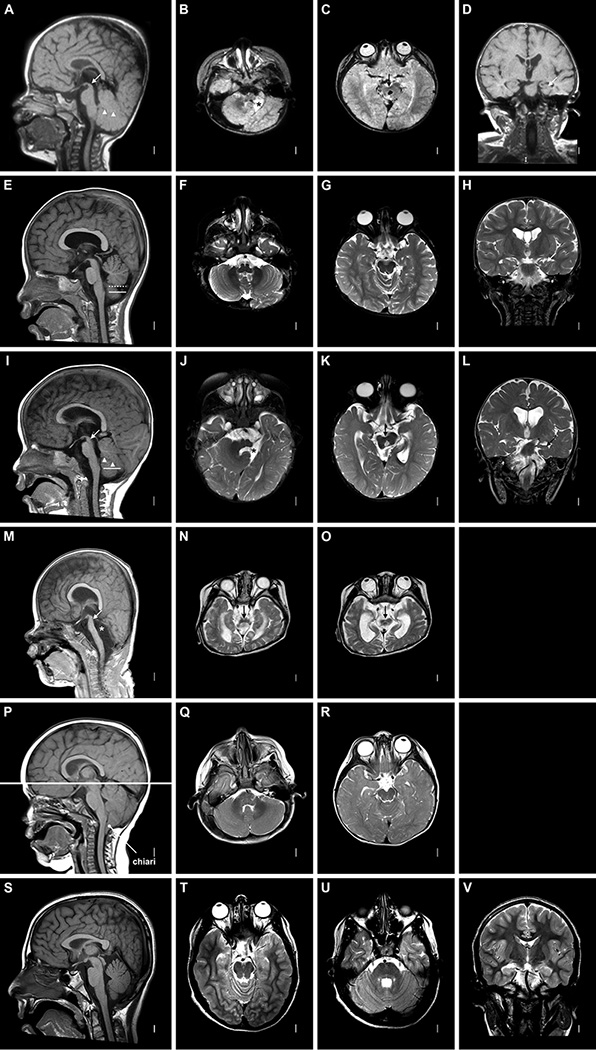
Figure 1. Brain MRI with WNT1 mutations.

The images shown are T1-weighted mid-sagittal, T2-weighted axial images through the low and high brainstem, and T2-weighted coronal images through the hippocampus. These images show variable brainstem hypoplasia that is typically most severe in the midbrain especially the tectum. Imaging patterns include a normal brainstem (P–R), normal (A, E) or mildly small (I) pons and medulla with very small midbrain (A–C, I–K with arrows in A and I), and diffuse severe hypoplasia of the entire brainstem (M–O with arrow in M). The cerebellar vermis varies from normal (P) to small (mild in E, moderate in A and I) to completely absent (asterisk in M). In E, the dashed line marks the observed lower limit of the vermis and the solid line the expected lower limit of the vermis. The cerebellar hemispheres may appear normal (F, Q) or small (right hemispheres in B, J). Here the left cerebellar hemispheres are absent in two patients (asterisks in B, J), and the entire cerebellum is missing in one (M–O). The hippocampi are small and malformed (arrows in D, H, L). The gyral pattern and cortex appear normal. Images of a typically developing individual are shown for reference (S–V).
