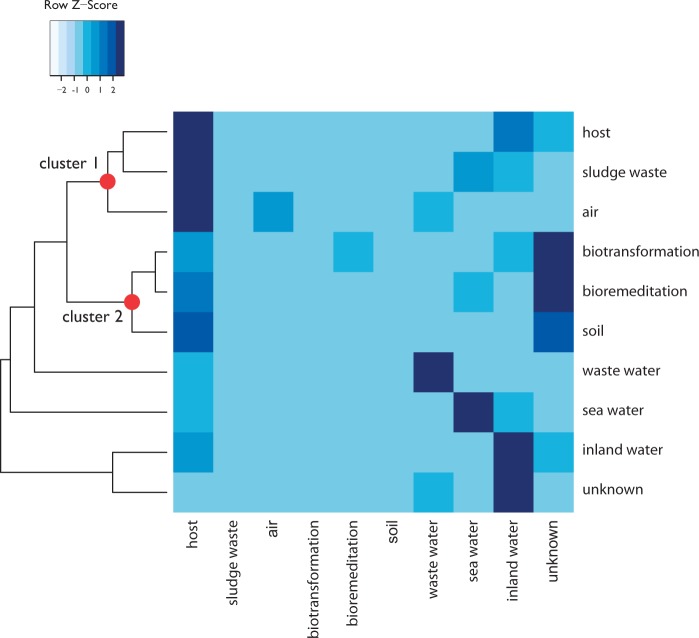
Fig. 5.—
Adjacency matrix showing the relationships among the different habitat types in the putative HGT events network. For each habitat, the proportion of connections of that habitat with all the other habitats has been computed. The proportion of connections connecting habitat A with habitat B () is given by this formula:Since the denominator represents the amount of sequences in one of the two analyzed samples, this measure is specific to each of the analyzed environments and is not symmetric (). Color gradient within the matrix refers to the proportion of connections of contigs from a given habitat with all the others from other habitats, with lighter tones representing less abundant interconnections among the corresponding habitats.

