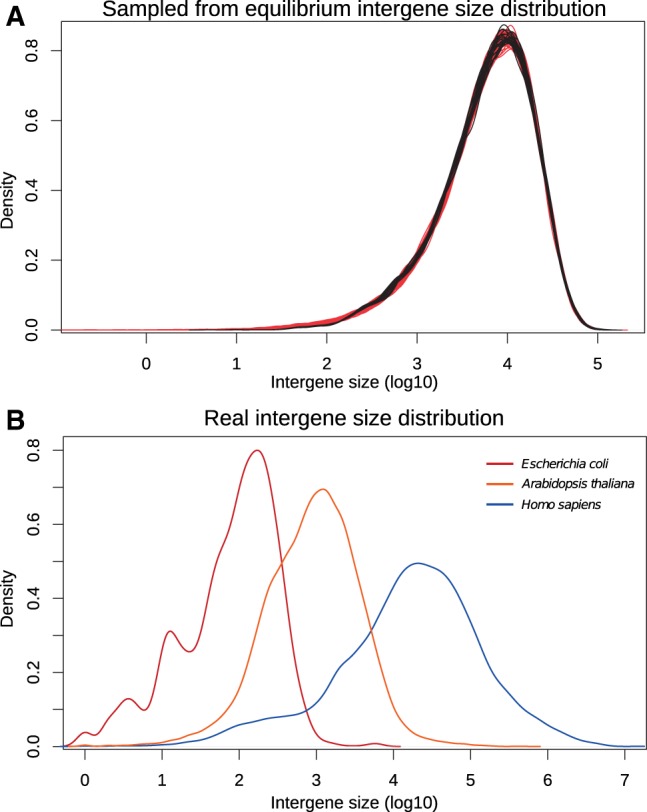
Fig. 2.—

Density of the set of the logarithms (base 10) of intergene sizes from (A) simulated genomes (black) sampled from the Markov chain process starting from a genome with 10,000 solid regions and equally distributed breakage probabilities, applying 500,000 inversions as a burn-in, and then sampling breakage probabilities every 10,000 additional inversions, or sampled genomes (red) by picking values in an exponential distribution and normalizing; (B) real genomes, chosen among diverse model organisms: Homo sapiens (blue), Arabidopsis thaliana (orange), and Escherichia coli (red).
