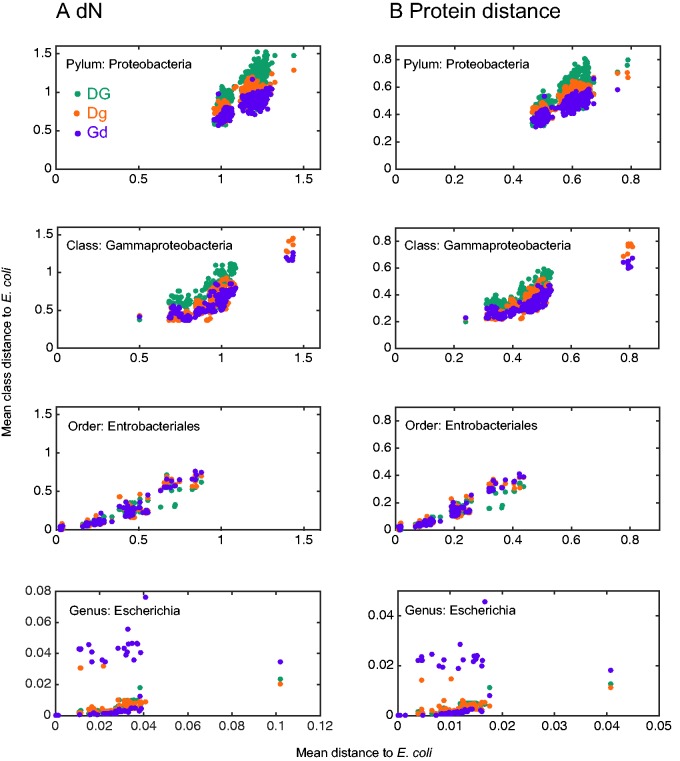
Fig. 3.—
Evolutionary rates of combined DnaK and GroEL dependency classes. Each data point represents the mean of distances of all class members in one genome from their orthologs in E. coli K12. Comparisons are shown in four taxonomic depths: genus (Escherichia), order (Enterobacteriales), class (Gammaproteobacteria), and phylum (Proteobacteria). The taxonomic depth samples are mutually exclusive.

