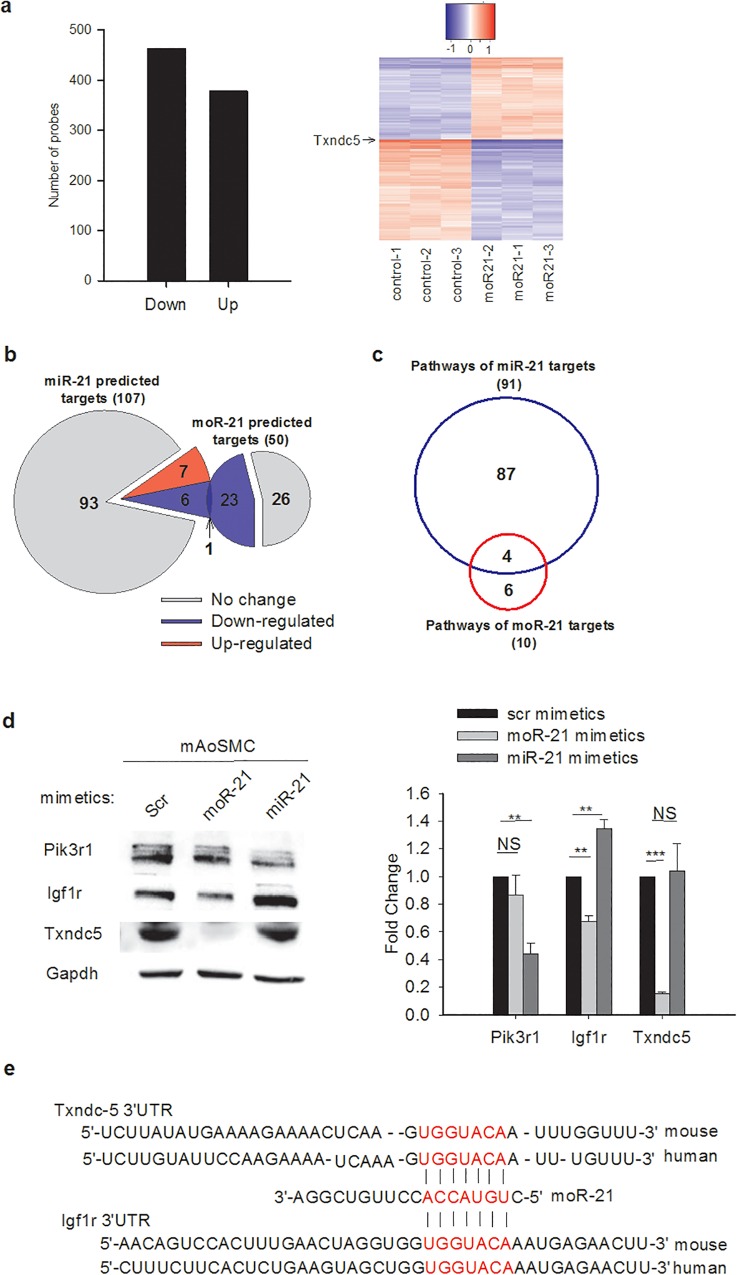
Fig 2. moR-21 plays a role in gene regulation and has a different target gene set from miR-21.
(a) Differentially expressed transcripts in moR-21 over-expressed VSMC compared with scrambled control-treated cells. In moR-21-treated cells, 460 and 378 transcripts were down- or up-regulated, respectively. Fold change cutoff is 1.3 and adjusted P< 0.002. Right panel: a differential expression heatmap for all 838 genes that were significantly regulated by moR-21 showing the log base 2 expression value for each sample minus the average log base 2 expression value for all samples (three control and three moR-21 treated). (b) Comparison between miR-21 and moR-21 targets predicted by TargetScan and their regulation by moR-21, as detected by microarray in VSMC. (c) Comparison of molecular pathways that predicted miR-21 and moR-21 targets participate in. The analysis was performed using IPA with a P-value cutoff < 0.05. d, Pik3r1, Igf1r, and Txndc5 protein abundance in scrambled control, moR-21, or miR-21 mimetic treated mAoSMC cells. Representative western blots are presented. Densitometry analysis for western blots is shown at the bottom. e. Conserved moR-21 binding sites in the 3’UTR of Txndc-5 and Igf1r. Data are from at least 4 independent experiments and presented as fold change. Values are mean ± SEM. The significance of differences between different treatments was determined by Student’s t-test. NS: non-significant, **: P<0.01, ***: P<0.001.

