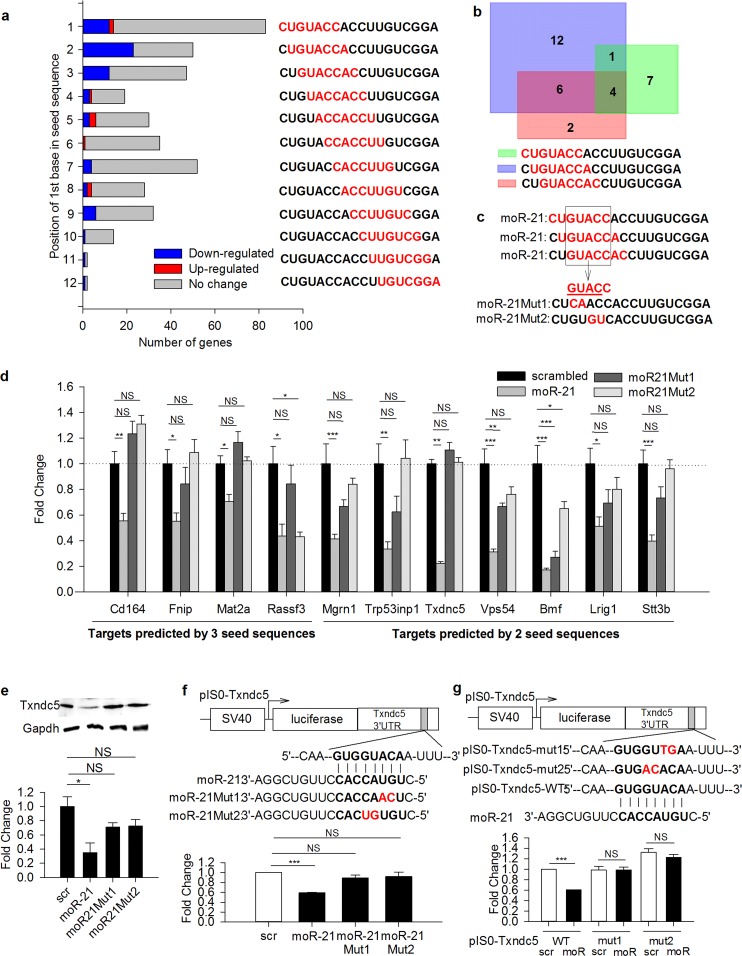
Fig 4. “Seed” region plays a key role in moR-21-mediated gene down-regulation.
(a) Target prediction analysis for all potential “seed” sequences (highlighted in red). Numbers of predicted targets that were significantly down-regulated, up-regulated or unchanged in the microarray are represented by blue, red, and grey bars, respectively. (b) Overlap among down-regulated targets predicted by the first 3 “seed” sequences. (c) The common region of the first 3 “seed” sequences is GUACC. Each moR-21 mutant (Mut1 and Mut2) carries 2 nucleotide substitutions in the common region, which are highlighted in red. (d) Effects of wild-type and mutated moR-21 mimetics on the mRNA levels of the 11 targets genes predicted by 2 or 3 potential “seed” sequences. Each gene expression level was calculated as relative fold change compared to the scrambled control-treated sample. B2M was used as an internal control for RT-qPCR. Data are shown as mean ± SEM and are from at least 5 independent experiments. (e) Txndc5 protein abundance in scrambled control, wild type moR-21, and mutated moR-21 treated cells. Representative western blot is presented. Densitometry analysis for western blots is shown at the bottom. Data are shown as mean ± SEM and are from at least 3 independent experiments. (f) (g) Schematic presentation of Txndc5 3’UTR luciferase reporter and luciferase assay. A perfect match between the “seed” region in moR-21 and the “seed match” region in Txndc5 3’UTR is represented by short vertical lines. Nucleotide substitutions in moR-21 “seed” region (f) and Txndc5 3’UTR “seed match” region (g) are highlighted in red. Luciferase activity was normalized to beta-gal activity. Data are presented as fold change, compared with scrambled control-treated cells. Values shown are mean ± SEM of at least 3 independent experiments. The significance of differences between different treatments was determined by one-way analysis of variance (ANOVA), followed by Tukey’s test (b) or Student’s t-test (c), and Student’s t-test (d,e). NS: non-significant, *: P<0.05, **: P<0.01, ***: P<0.001.

