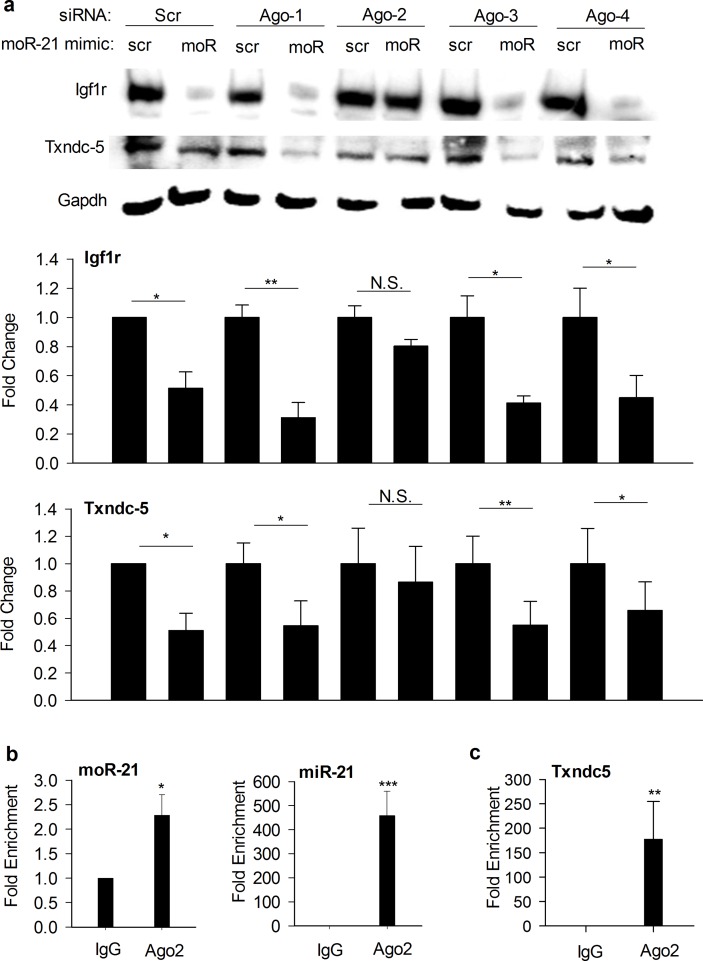
Fig 5. Ago2 is required for moR-21-mediated gene repression.
(a) Immunoblot analysis showing the effects of knocking-down Ago1-4 on Igfr1 and Txndc5 protein abundance in moR-21 over-expressing cells. Scr: transfection control with scrambled siRNA or small RNA mimetic. Gapdh: loading control. Lower bar graphs show densitometry results in line with the representative blots. Data are from 3–5 independent experiments and presented as fold change. Values are mean ± SEM. b,c RIP analysis of HEK293 cell lysates to measure the interaction of Ago2 with endogenous miR-21 or moR-21 (b), and Txndc5 (c). Normal mouse IgG served as IP control. MoR-21, miR-21, or Txndc5 abundance was quantified using RT-qPCR and represented as fold enrichment in Ago2 RIP compared with IgG RIP. Data are from 4 independent experiments. Values are mean ± SEM. The significance of differences between different treatments was determined by Student’s t-test. NS: non-significant, *: P<0.05, **: P<0.01, ***: P <0.001.

