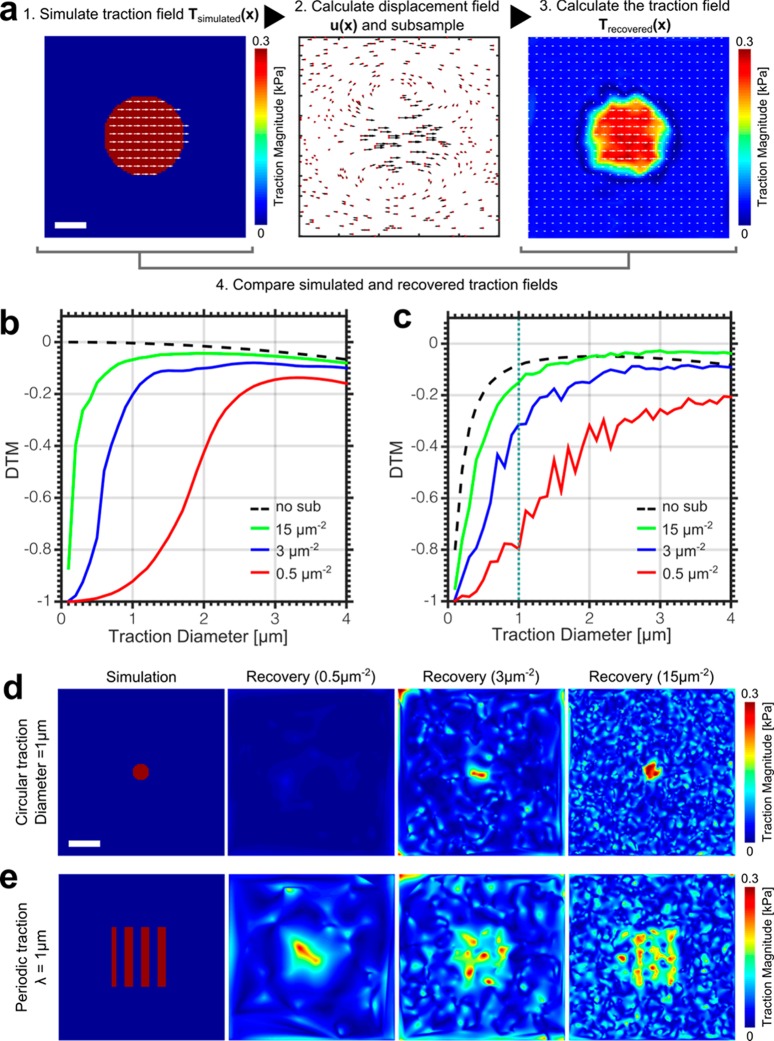
Figure 2.
Outline of the simulation process. (a) A uniform circular traction field Tsimulated(x) is simulated and the corresponding displacement field u(x) calculated (heat map; high traction magnitude warm colors, low traction magnitudes cold colors, white arrows: traction direction). The displacement field is then subsampled at a confocal and STED density (red dots: bead positions, black arrows: bead displacements), the traction field recovered Trecovered(x) and the simulation and recovery compared by the deviation of traction magnitude (DTM). Scale bar 1 μm. (b) DTM for varying traction diameters at three sampling densities, confocal (red), medium STED (blue), and maximum STED (green). A DTM of 0 represents a perfect traction recovery, whereas a DTM of −1 represents a complete underestimation. Dotted line: DTM for no subsampling. Line deviates from zero at large tractions due to artifacts introduced by the finite size of the simulated gel area. (c) Same as b with the addition of artificial noise and using the regularized solution, showing very similar dependency as b except for the no subsampling case (dotted line), where regularization masks the recovered tractions at length scales matching that of the artificial noise. (d) Simulation and traction recovery for a 1 μm diameter circular traction zone (0.3 kPa). Scale bar 2 μm. (e) Simulation and traction recovery for a 1 μm wavelength periodic traction pattern (0–0.3 kPa). Scale bar 2 μm.

