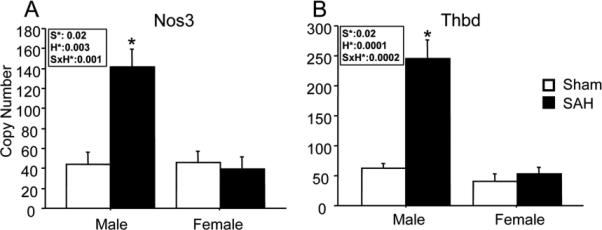
Figure-2. Genes with sexually dimorphic response after SAH.

Expression of Nos3 and Thbd genes increased in males and not females after SAH. Open bars: sham; filled bars, SAH. Bars show mean relative mRNA copy number (9 animals per group). Inset boxes show ANOVA effect of sex (S), hemorrhage (H) and interaction between the two (SxH) for each gene. Effects which reach significance are in bold. 2 way ANOVA results: A; Nos3: sex effect (S): F=6, p=0.02; hemorrhage effect (H): F=11, p=0.003; sex by hemorrhage interaction (S*H): F=15, p=0.001. B; Thbd: S: F=7, p=0.02; H: F; 30, p<0.0001; S*H: F=23, p=0.0002. Data are mean ± sem. * significantly difference at P<0.05 in comparison of hemorrhage vs sham within sex.
