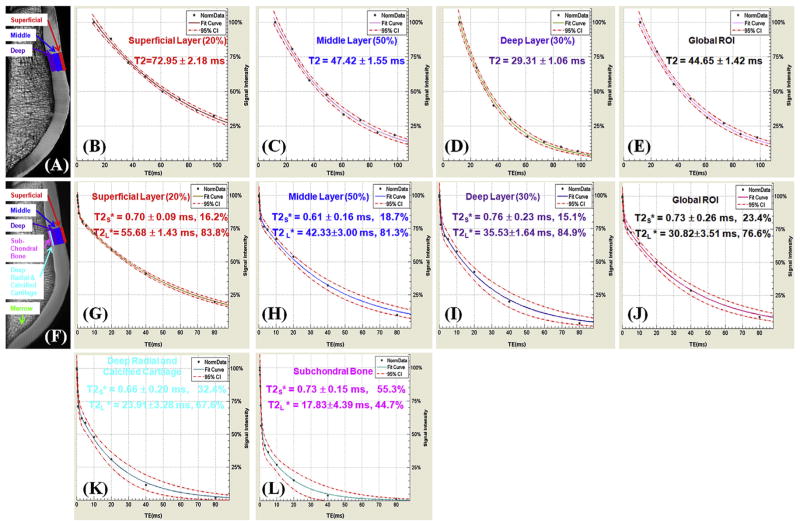
Fig. 2.
Single-component fitting of CPMG images of a normal patella specimen (A) with signal from ROIs drawn in the superficial (B), middle (C) and deep layers (D), and a global ROI (E), and bi-component fitting of UTE images of the same patella specimen (F) with signal from the same ROIs (G–J) as well as linear ROIs in the deep radial and calcified cartilage (K) and subchondral bone (L). T2 curves (B–E) show a single-component decay behavior with a T2 of 72.95 ms for the superficial layer (B), 47.42 ms for the middle layer (C) and 29.31 ms for the deep layer (D), and 44.65 ms for the global ROI (E). In (G–L) there is an obvious short T*2 component with a T*2 of 0.70 for the superficial layer (G), 0.61 ms for the middle layer (H), 0.76 ms for the deep layer (I), and 0.73 ms for the global ROI including all three layers (J). Furthermore, a short T2* of 0.66 ms was observed for the deep radial and calcified layer (K) and 0.73 ms for the subchondral bone (L). Long T2* components with T2*s of 55.68 (G), 42.33 (H), 35.53 (I), 30.83 (J), 23.91 (K), 17.83 (L) ms were also observed for the respective ROIs. Bound water fractions account for 23.4% for the global ROI (J),16.2% of the superficial layer (G), 18.7% for the middle layer (H), 15.1% for the deep layer (I), 32.4% for the deep radial and calcified cartilage (K) and 55.3% for the subchondral bone (L). 95% fitting confidence level was displayed for each fitting with n = 8 for CPMG T2 analysis and n = 12 for UTE T2* bi-component analysis. Fitting errors in single component T2 analysis and bi-component T2* analysis were also displayed.

