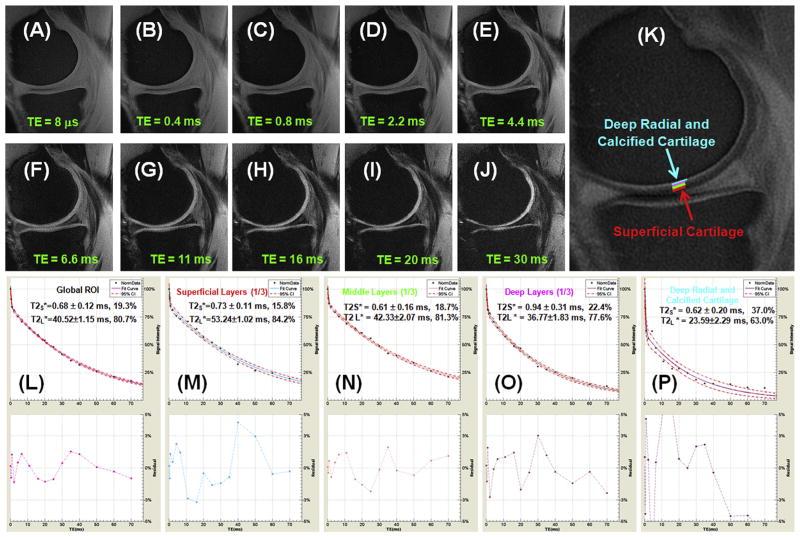
Fig. 6.
UTE imaging of a 59 year old volunteer who is a regular runner and in good health. Selected interleaved 4-echo UTE acquisitions with a TE of 8 μs (A), 0.4 ms (B), 0.8 ms (C), 2.2 ms (D), 4.4 ms (E), 6.6 ms (F), 11 ms (G), 16 ms (H), 20 ms (I), 30 ms (J), echo subtraction (K), and bi-component T2* analysis for the global ROI (L), superficial layer (M), middle layer (N), deep layer (O) and deep radial and calcified cartilage (P). The echo subtraction image was generated by subtracting the image with a TE of 2.2 ms from the first image with a TE of 8 μs. ROIs for the different layers of femoral cartilage were shown in (K). 95% fitting confidence level was displayed UTE T2* bi-component analysis with n = 16.

