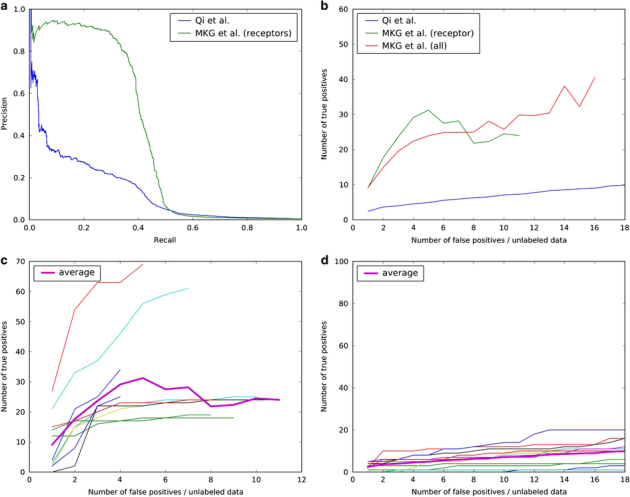
Figure 1.

Computational evaluation of predicted protein–protein interactions on hub proteins: (a) precision recall curve. (b) True positive versus false positives in ranked lists of hub type membrane receptors for our method and that by Qi et al. True positives versus false positives are shown for individual membrane receptors by our method in (c) and by Qi et al. in (d). Thick line is the average, which is also the same as shown in (b). Note: x-axis is recall in (a), whereas it is number of false positives in (b–d). The range of y-axis is observed by varying the threshold from 1.0–0 in (a), and to 0.5 in (b–d).
