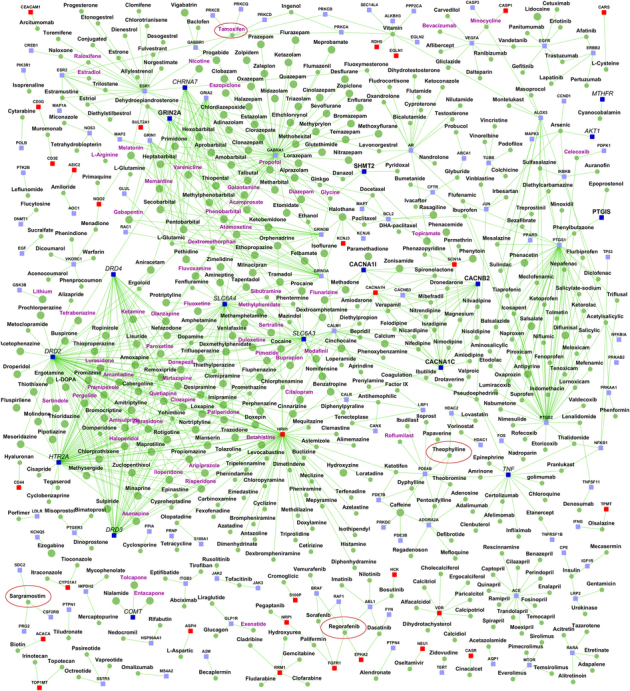
Figure 6.

Gene–drug interactome. The network shows the drugs that target genes from the schizophrenia interactome. Drugs are shown as round nodes colored in green and genes as square nodes colored in dark blue (schizophrenia genes), light blue (known interactors), and red (novel interactors). Nervous system drugs (based on Anatomic category of ATC classification) are shown as larger size green colored nodes compared with other drugs. Drugs that are in clinical trials for schizophrenia are labeled purple. ATC, anatomic, therapeutic and chemical classification.
