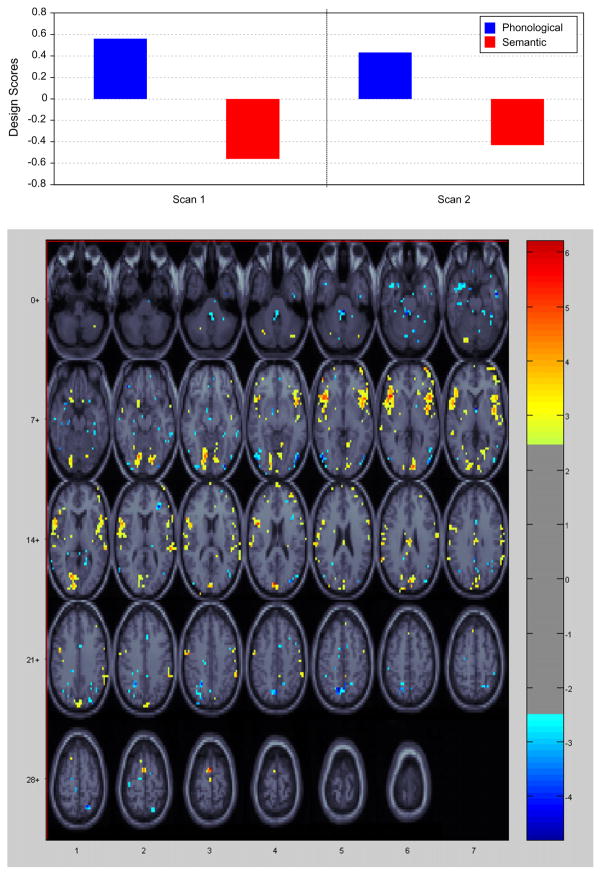
Fig. 3.
Healthy control subject activation during the phonological and semantic tasks. Activations denoted in yellow/red represent brain regions that positively correlate with the phonological task and negatively with the semantic task. Activations denoted in blue represent brain regions that positively correlate with the semantic task and negatively with the phonological task. The images show the active areas on a standard MRI scan in which the right side of the brain is shown on the right side of the image.

