
Figure 2.
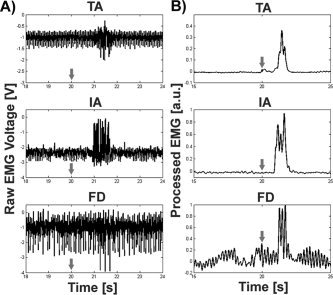
EMG during fMRI. A: Sample EMG time series excerpt from three muscle groups: right tibialis anterior (TA, top), right index abductor (IA, middle), right flexor digitorum (FD, bottom). fMRI‐induced noise is evident in all three traces to varying amounts, and is a function of multiple parameters including distance of the leads from the isocenter, electrode placement, and skin impedance. B: Processed EMG data for the same three muscles after PCA, rectification, and low‐pass filtering clearly delineates muscle burst for TA and IA, whereas results for FD are poorer. Each row represents data from a different participant. The arrows represent the timing for the visual cue.