
Figure 3.
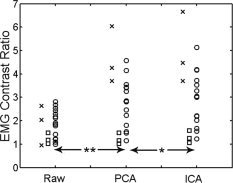
Contrast ratio (CR) for raw and processed EMG signals. Significant incremental improvement in EMG signal contrast was observed when the raw EMG signals were processed with both principal component analysis (PCA) and independent component analysis (ICA). Data points represent individual participants (symbols: circle = TA, square = FD, x = IA; **P < 0.0002, *P < 0.02).