
Figure 4.
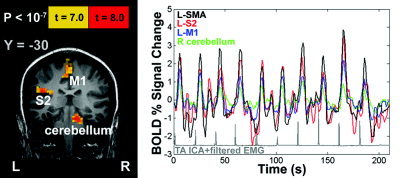
EMG and fMRI results from a representative participant. Left: fMRI results show areas activated as a result of brief ankle dorsiflexion movements. Right: associated BOLD fMRI time series data from four regions of interest. Processed EMG data (ICA + rectification + low‐pass filter) are shown below in gray. SMA: supplementary motor area; SII: secondary somatosensory cortex; M1: primary motor cortex.