
Figure 5.
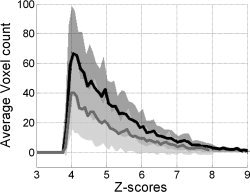
Average Z‐score histograms across participants and sessions during ankle dorsiflexion fMRI (Z > 3.951, P < 0.01; EMG‐guided, solid black; Visual cue‐guided, solid gray). Dark and light gray fills correspond to the 95% confidence intervals for EMG‐guided and Visual cue‐guided analysis, respectively.