
Figure 6.
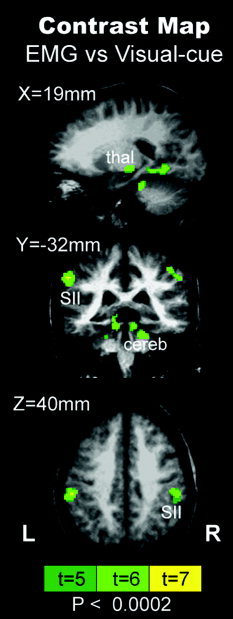
Mixed‐effect ANOVA group contrast map between EMG‐guided and Visual cue‐guided fMRI analysis (P < 0.0002). Regions such as bilateral secondary somatosensory cortices (SII), cerebellum (cereb), and right thalamus (thal) were detected more readily using EMG‐derived information. No significant voxels were found for the reverse contrast.