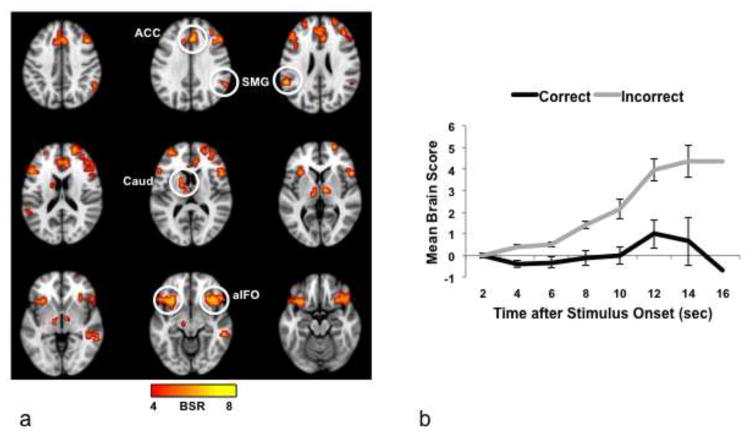
Figure 2.
(a) Brain areas with more activity for incorrect responses (image taken from the 8th time point, i.e., 16 sec after the beginning of the trial, where the difference between correct and incorrect responses was maximal). BSR = bootstrap ratio; the color bar indicates the range of BSRs used to make the brain image. Regions indicated by circles: ACC, anterior cingulate; aIFO, anterior insula/frontal operculum; Caud, caudate nucleus, SMG, supramarginal gyrus. (b) Mean brain scores collapsed across groups and condition. The brain score is a summary measure that indicates the degree to which each participant expresses the activity pattern seen in (a). If the mean brain score is positive at a given time, this indicates more activity relative to the first time point in the trial (i.e., 0–2 sec after stimulus onset). Error bars represent the S.E.

