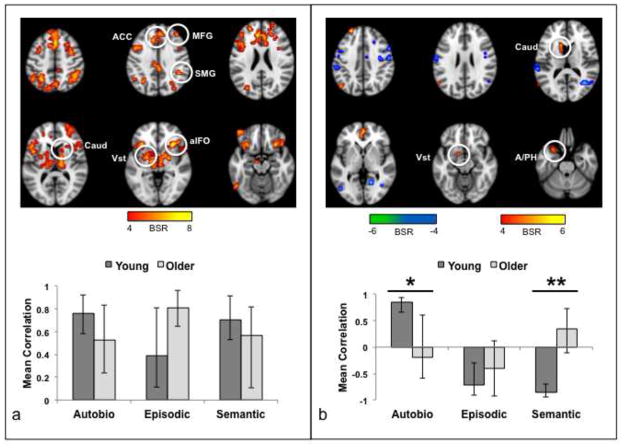
Figure 5.
Results of the functional connectivity analysis for the aIFO seeds during the incorrect trials. (a) The brain image shows the regions where activity was robustly correlated with the seeds in the first significant pattern. The graph shows the mean correlation (averaged for right and left aIFO) between seed activity and the brain scores (i.e., the summary measure of functional connectivity for each participant). The brain measures were averaged across right and left hemispheres because there were no differences in the correlations for right and left aIFO in either group. There were no age differences in the correlations or differences across memory condition. Error bars are the average confidence intervals for left and right seed correlations. (b) The brain image shows the regions where activity was robustly correlated with the seeds in the second significant pattern. The graph shows the mean correlation (averaged for right and left aIFO). Areas shown in warm colors were positively correlated with the seeds during AM in young adults and cool colored areas were positively correlated with the seeds for EM and SM in young adults. * = O < Y for right aIFO. ** = O < Y for both seeds (see Table 2 for the correlation values for each seed and group). Error bars are the average confidence intervals for left and right seed correlations. The color bars indicate the range of BSRs used to make the brain images. Regions indicated by circles: ACC, anterior cingulate; aIFO, anterior insula/frontal operculum; Vst, ventral striatum; Caud, caudate nucleus; SMG, supramarginal gyrus; MFG, middle frontal gyrus; A/PH, amygdala/parahippocampal gyrus.

