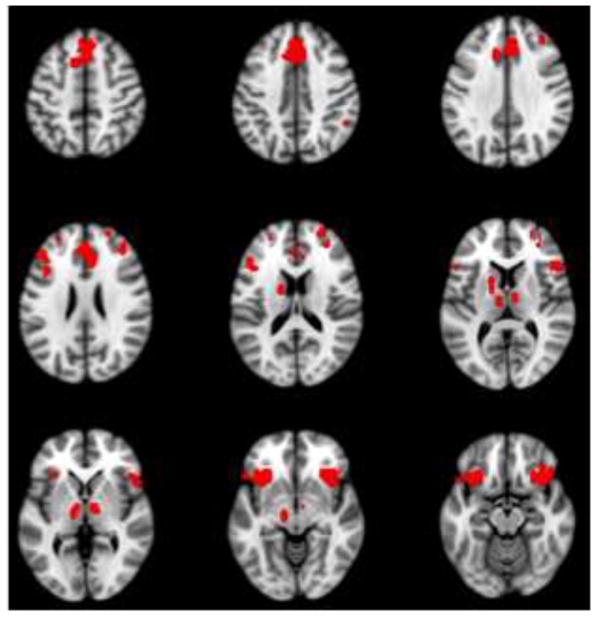
Figure 7.
The red regions indicate where there was overlap among the regions with more activity for incorrect trials (see Figure 2a), strong functional connectivity with aIFO seeds during incorrect trials (see Figure 5a) and strong intrinsic functional connectivity with aIFO seeds (see Figure 6a). These regions are consistent with the SLN, indicating that this network is engaged for recall errors and shows robust intrinsic and task-related functional connectivity. To make this overlap map, the BSR thresholds from the original images were used (see Figures 2a, 5a and 6a).

