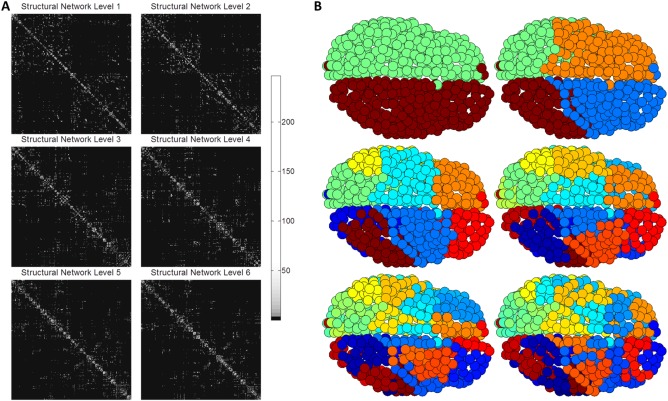
Figure 1.

To illustrate PLACE‐based hierarchical modularity, Figure 1A shows the structural networks rearranged according to the community structure created from PLACE. Figure 1B visualizes, on the surface of an individual participant's brain, the subsequent extracted modular structure (each color represents one community) of the mean connectome, which is formed by averaging element‐wise the connectomes of all 39 subjects for the 620‐parcellation scheme (7 subjects out of 46 had disconnected networks and thus were excluded).
