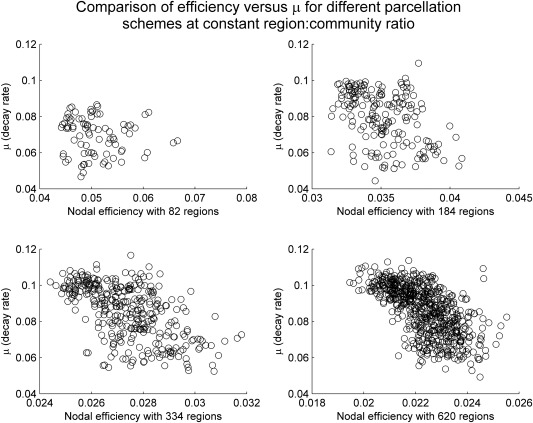
Figure 3.

In this figure, we plot the rate constant μ, obtained from fitting for each region i, against the nodal efficiency in all four parcellation schemes. We note that in general less efficient nodes (those with low nodal efficiency ) tend to also have higher rates of decay; by contrast, nodes that have lower decay rate can have either low, medium, or high nodal efficiency . In fact, if we restrict ourselves to nodes with decay rates less than 0.08, the correlation between and becomes statistically insignificant except for the 620‐parcelation scheme (P = 0.041) before correcting for multiple corrections (all insignificant after controlling for multiple comparisons).
