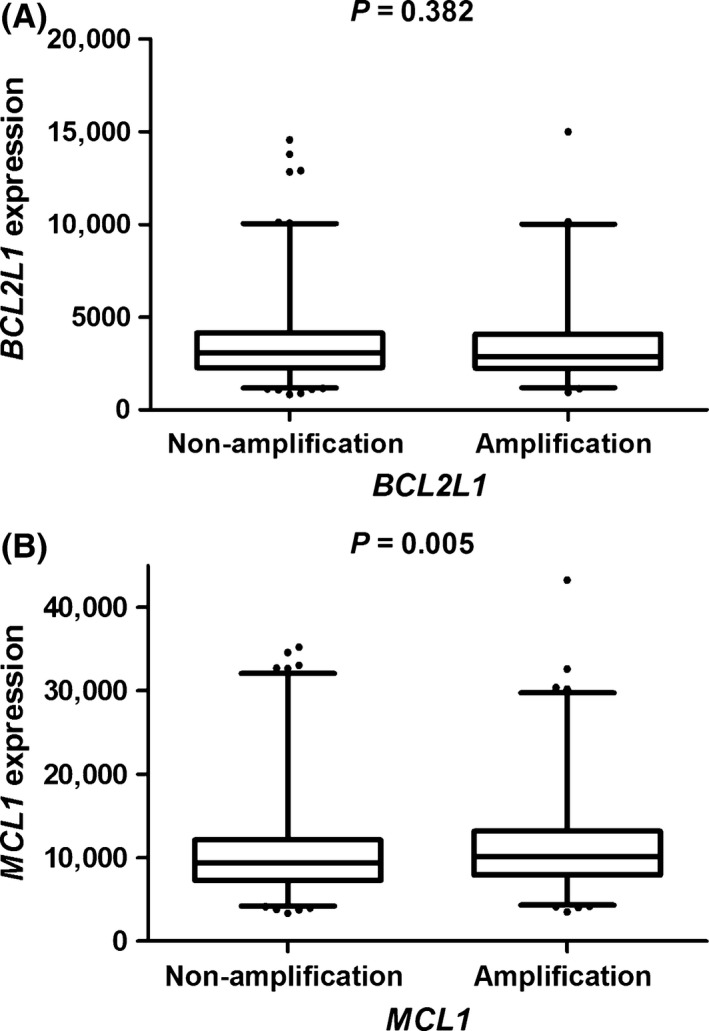
Figure 2.

Analyses of BCL2L1 (A) and MCL1 (B) mRNA expression levels by corresponding CNV status in 986 NSCLC patients’ tumor tissues from the TCGA Project. CNV, copy‐number variation; TCGA, The Cancer Genome Atlas.

Analyses of BCL2L1 (A) and MCL1 (B) mRNA expression levels by corresponding CNV status in 986 NSCLC patients’ tumor tissues from the TCGA Project. CNV, copy‐number variation; TCGA, The Cancer Genome Atlas.