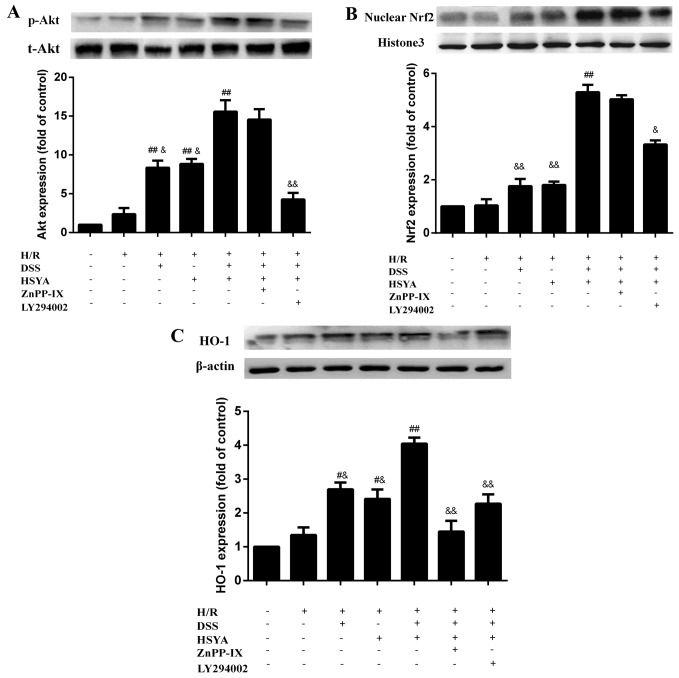
Figure 8.
(A) Protein kinase B (Akt), (B) nuclear factor erythroid 2-related factor 2 (Nrf2) and (C) heme oxygenase-1 (HO-1) levels in the control (Con), hypoxia/reoxygenation (H/R), H/R + Danshensu (DSS; 80 µM), H/R + hydroxysafflor yellow A (HSYA; 80 µM), H/R + DSS + HSYA (40+40 µM), H/R + DH + zinc protoporphyrin IX (ZnPP-IX; 10 µM) and H/R + DH + LY294002 (50 µM) groups. Data obtained from half-quantitative densitometry are presented as the means ± SD of 3 independent experiments. #P<0.05 and ##P<0.01 vs. H/R group; &P<0.05 and &&P<0.01 vs. H/R + DH group. Note that cropped gel images are used in this figure and the gels were run under the same experimental conditions. t-AKT, total AKT; p-AKT, phospho-AKT.

