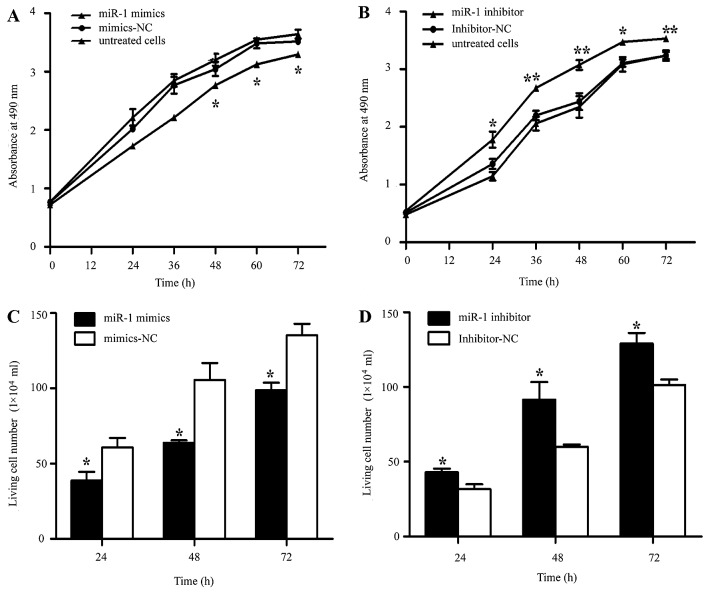
Figure 4.
Effect of miR-1 overexpression/downregulation on cell proliferation. (A) MTT assay following transfection with miR-1 mimics or mimics-negative control (NC). *P<0.05, miR-1 mimics vs. mimics-NC (B) MTT assay following transfection with miR-1 inhibitor and inhibitor-NC. *P<0.05, miR-1 inhibitor vs. inhibitor-NC. (C) Living cell counts following transfection with miR-1 mimics or mimics-NC. (D) Living cell counts following transfection with miR-1 inhibitor or inhibitor-NC. Data are represented as the means ± SEM ± SD. *P<0.05, **P<0.01.

