Figure 7.


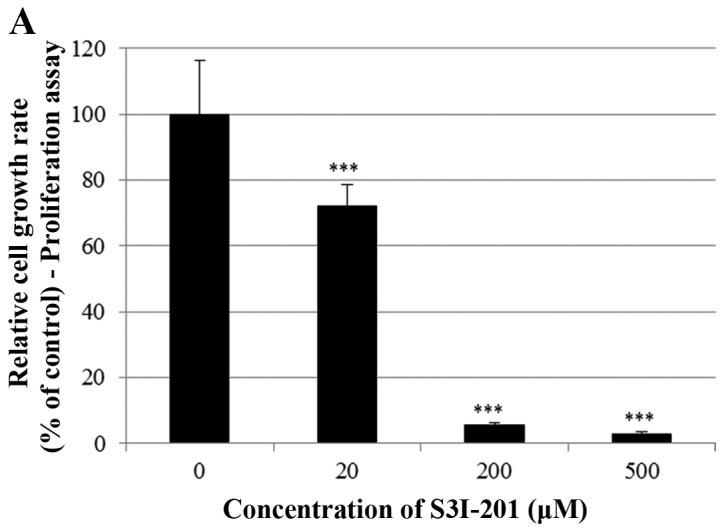
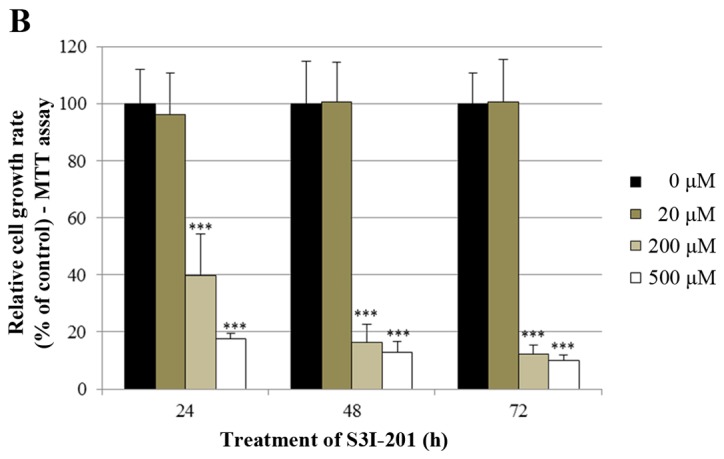
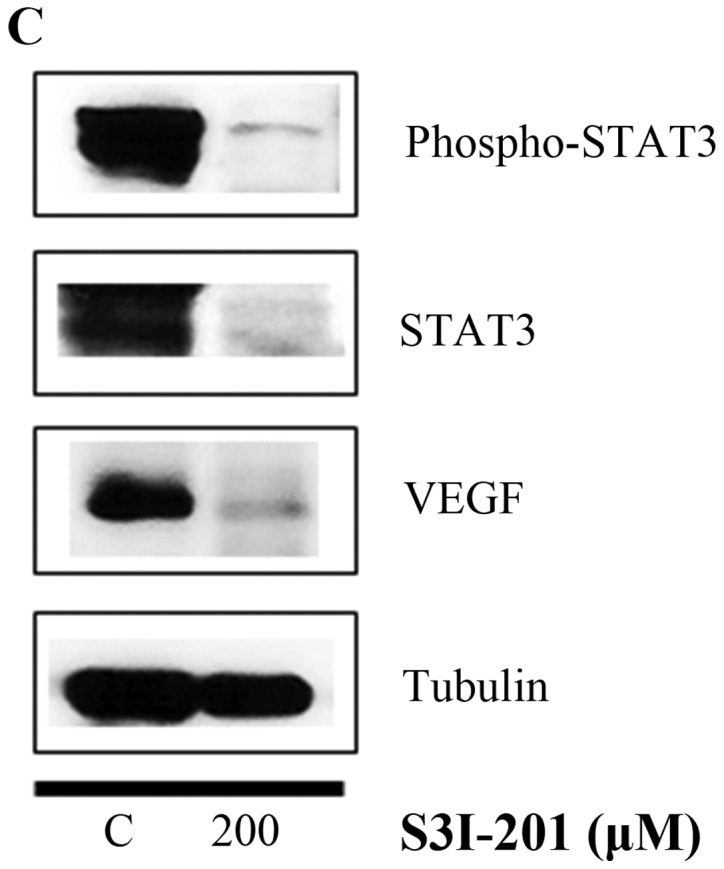
Effect of the STAT3 inhibitor S3I-201 on the growth of BT-474 cells. (A) BT-474 cells were treated with different doses of the STAT3 inhibitor S3I-201 (0–500 µM). After 72 h, the cell viability was assessed using a cell proliferation assay. (B) BT-474 cells were treated with different doses of the STAT3 inhibitor S3I-201 (0-500 µM). The relative cell growth rate was measured by MTT assay after 24, 48 and 72 h. The growth rate of the vehicle-treated cells was set to 100%, and the relative decrease in cell viability resulting from the S3I-201 treatment was expressed as a percentage of the control. Data are shown as the means of three independent experiments (error bars denote SD). ***P<0.001. (C) BT-474 cells were treated with the STAT3 inhibitor S3I-201 for 24 h. Whole cell lysates were analyzed by western blotting with anti-p-STAT3, anti-STAT3, anti-VEGF and anti-tubulin antibodies. The data shown are representative of three independent experiments that gave similar results.
