Figure 3.
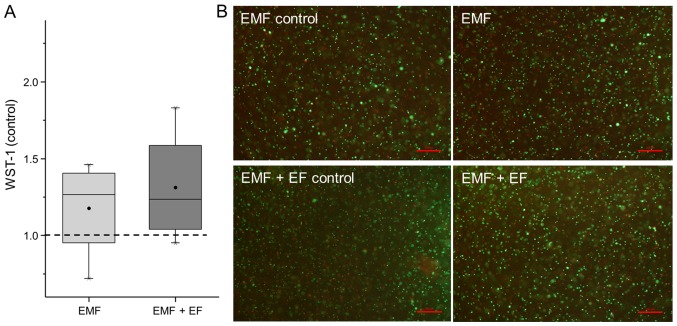
Influence of EMF and electromagnetic fields combined with an additional alternating electric field (EMF + EF) on metabolic activity and viability of human osteoblasts after 3 days. (A) Metabolic activity was quantified using WST-1 assay. Data (n=4) are normalised to the respective control and presented in box plots, whereby boxes identify interquartile ranges, horizontal lines within the boxes indicate the median, black dots show the mean and whiskers denote minimum and maximum values. Statistical analysis was conducted by one-way ANOVA (p<0.05). (B) Fluorescent microscopic photographs of live/dead staining. Viable cells fluoresced green and dead cells fluoresced red (bar, 200 µm).

