
Figure 2. V2a Brainstem Neurons Stop Slow-Frequency Locomotor-like Activity In Vitro.
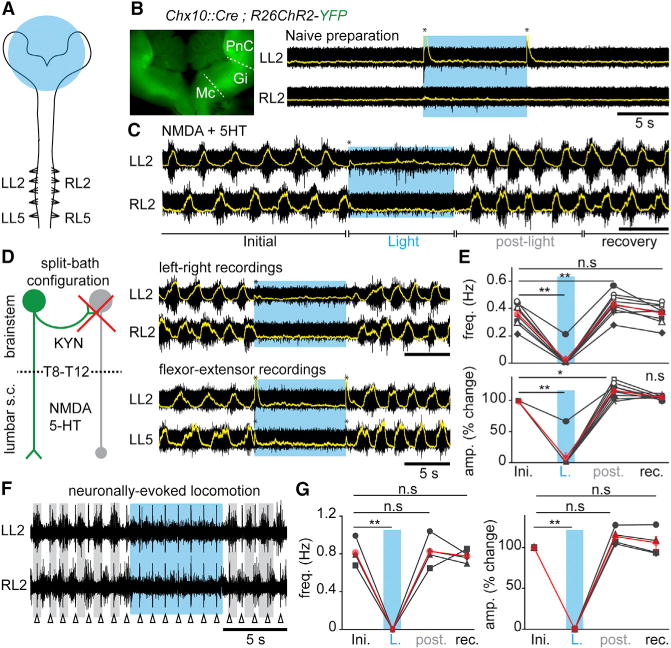
(A) Schematic experimental design for electrophysiological recordings in brainstem-spinal cord preparations from postnatal animals (0–4 days). The area of light stimulation is shown in blue.
(B) Inset: ChR2-YFP expression in the “open-book” brainstem preparation. Raw (black) and integrated signals (superimposed in yellow) of L2 ventral roots in normal Ringer solution. Light-activation of brainstem V2a neurons (blue epoch) does not change baseline activity. The transient voltage deflections at light onset and offset (asterisks) are light-mediated artifacts.
(C) Similar recordings during locomotor-like activity induced with 5–7 μM NMDA and 8 μM 5-HT. Light-activation of brainstem V2a neurons stops ongoing locomotor-like activity.
(D) Left: the possible recruitment by V2a neurons (green) of other inhibitory descending neurons (gray) was blocked by applying KYN onto the brainstem in a split-bath configuration. Right: recordings of the flexor-dominated roots bilaterally (L2, top) and of flexor and extensor (L5)-dominated roots on the same side (bottom).
(E) Average per animal (black, n = 9) and grand average among animals (red) of the instantaneous frequency and of the percent change in amplitude of drug-evoked locomotor bursts before (Initial: ini.), during light (L.), for 5 cycles following light offset (post), and for the following 20 s (recovery: rec).
(F) Recordings of L2 roots bilaterally in the split-bath configuration during electrical stimulation (1Hz, Δ) at the first cervical segment. Vertical lines are stimulus artifacts.
(G) Average per animal (black, n = 4) and grand-average among animals (red) of the instantaneous frequency and of the percent change in amplitude of descending fiber evoked locomotor bursts.
In all panels: n.s. indicates non-significant, * indicates p < 0.05 and ** indicates p < 0.01 (paired t test); Error bars in (E) and (G) are SEM.