
Figure 3. Light-Activation of Brainstem V2a Neurons Depresses Rhythm-Generating Levels of the Locomotor CPG.
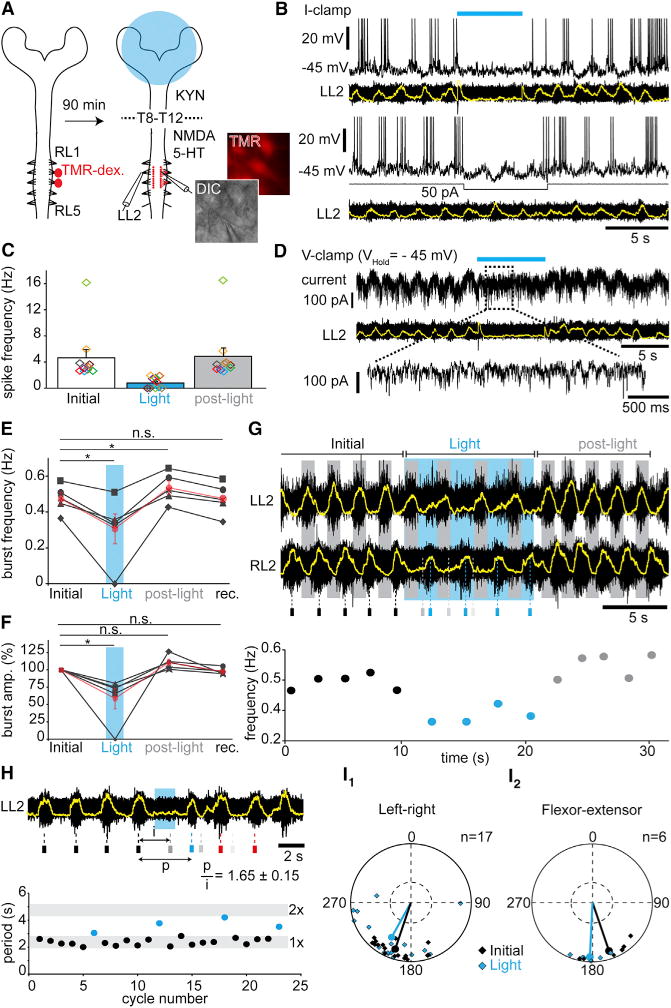
(A) Experimental design for labeling and whole-cell recording of lumbar motor neurons. TMR-dex: Tetramethyl-Rhodamine Dextran.
(B) L2 motor neuron in current-clamp during drug-evoked locomotor-like activity. V2a neurons’ activation (blue bar) arrests both spiking and underlying membrane oscillations (top), while direct hyperpolarization of the same cell with current injection (bottom) preserves subthreshold oscillations.
(C) Average per cell (colored rectangles, n = 10) and grand-average among cells (bar-graphs) of the instantaneous spiking frequencies of lumbar motor neurons before (initial), during (Light) and after (post-light) light-activation.
(D) Same cell as in (B) recorded in voltage-clamp. Light-activation induces a loss of rhythmic currents.
(E–F) Average per animal (n = 5) and grand-average among animals (red) of the instantaneous frequency (E) and of the percent changes in amplitude (F) of L2 locomotor bursts on preparations facing high NMDA concentrations (> 8 μM). * indicates p < 0.05 (paired t test).
(G) Typical L2 ventral root recording during high-frequency locomotor-like activity (~0.5 Hz). Small rectangles below indicate the time of peak of the control RL2 bursts (black), and their forecasted (gray) and actual occurrences (blue) during light activation of brainstem V2a neurons, showing a non-graded slowing of the rhythm. Below is plotted the corresponding instantaneous frequency of RL2 bursts.
(H) L2 ventral root recording during drug-evoked locomotor-like activity. The expected burst is silenced (gray bar below) and the rhythm reset by short light-pulse, as seen by the perturbed period (p) not falling in the range of twice the initial period (i). The graph below illustrates initial (black) and perturbed periods (blue) for four consecutive trials.
(I) Circular plot showing the left-right (I1) or flexor-extensor (I2) phase-relationships for individual trials and for the mean preferred phase among all trials before (Initial, black) and during (Light, blue) light-activation. Phase values falling in the bottom-half of the outer circles indicate alternation. There is no significant difference between control and light conditions (Watson-William’s test p > 0.05). See also Figure S3 and S4.
Error bars in (C), (E), and (F) are SEM.