
Figure 6. Blocking Synaptic Output from V2a Stop Neurons Increases Mobility.
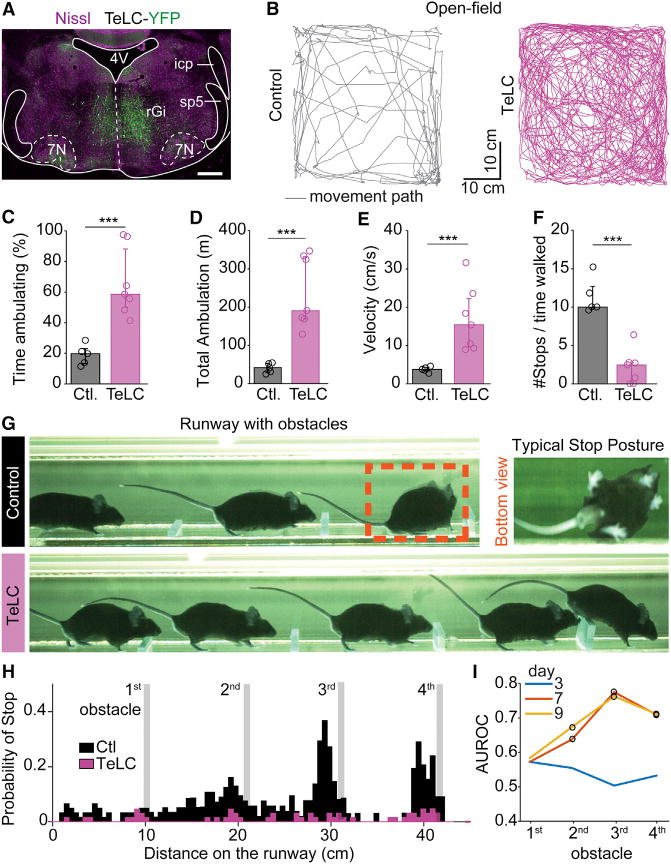
(A) Transverse brainstem section showing the expression of an AAV1/2-FLEX-TeLC-eYFP-WPRE virus following injection in the rGi bilaterally in a Chx10∷Cre animal.
(B) Traces of movements for 10 min in an open field test 7 days after the injection of saline (control, left) or the TeLC virus (right).
(C) Averages from individual animals (open circles) and grand-average among all individuals (bargraphs) of the percent time spent ambulating for controls (gray, n = 5) and TeLC-treated (pink, n = 8) subjects. Error bars are 25–75 percentiles. In all panels *** indicates p < 0.005 (U test).
(D–F) Similar quantifications for (D) the total distance achieved while ambulating, (E) the average velocity of ambulation, and (F) the relative number of stops to the time spent ambulating.
(G) Snapshots of a Chx10∷Cre mouse 9 days post-injection of saline (control, top) or TeLC virus (bottom) in the rGi. The control animal shown spontaneously halts before the 3rd obstacle and adopts a stereotypical stopping position, while the TeLC-treated animal does not stop at any obstacle (see also Movie S3).
(H) Summary of the probability of stop for saline-(n = 6, black) or TeLC-injected (n = 8, pink) mice, after 9 days. Controls stopped with higher probability on the 3rd and 4th obstacles (p < 0.05, Kruskal-Wallis, Bonferroni correction for multiple comparisons) than TeLC-treated animals.
(I) Direct comparison of the probability of stop before each obstacle between controls and TeLC mice. AUROC index gauges the difference between conditions where 0.5 indicates no difference while values toward zero or one indicate that the probability curves are different. Circles indicate significant differences (p < 0.05). See also Figure S6.