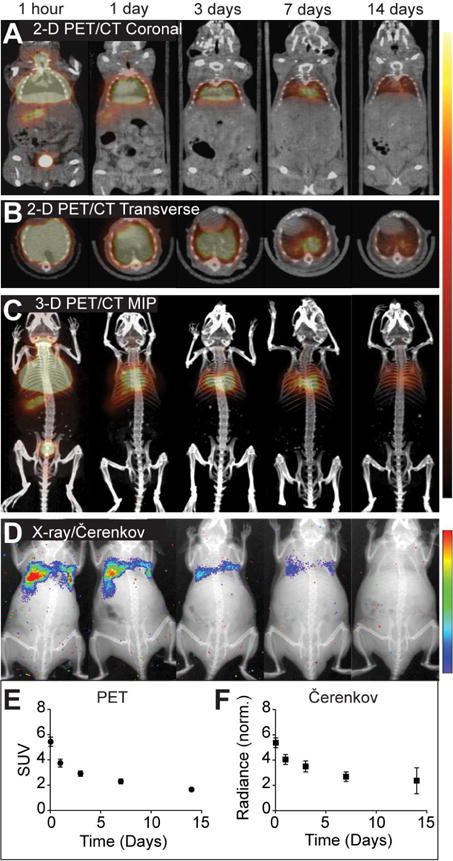
Figure 5. Multimodal imaging of 124I-labeled cSCK-pDNA complexes.

Representative images are shown at indicated times after intratracheal injection, of (A) 2-dimensional (2-D) PET/CT coronal slices, (B) 2-D PET/CT transverse slices, (C) PET/CT maximum intensity projections (MIPs), and (D) X-ray/Čerenkov luminescent imaging. The signal intensity scales are right of panel A–C and D. Image quantification of (E) standardized uptake values (SUV) from lung volumes in PET images and (F) normalized radiance from lung regions of interest, each corrected for 124I decay over time. Shown are the mean ± S.D (n = 8).
