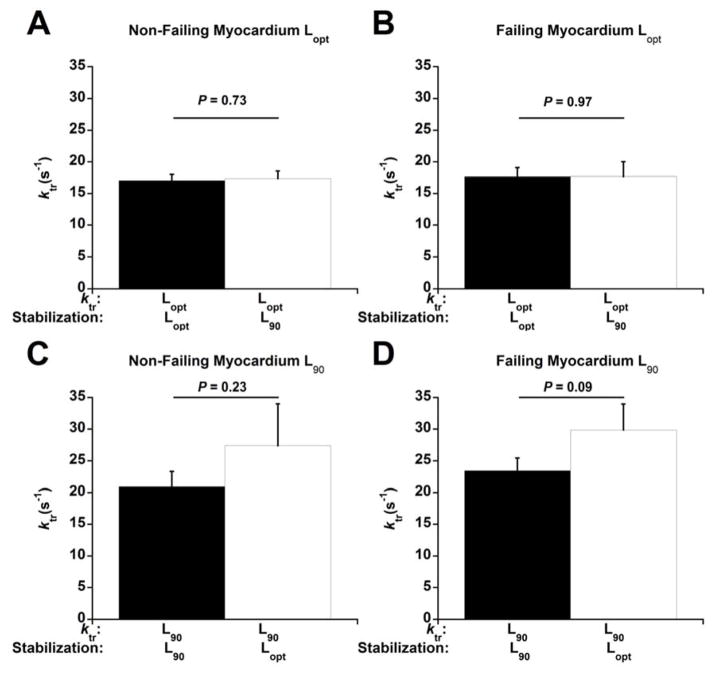
Figure 3.
ktr after rapid length changes. The length at which muscles were stabilized and ktrs performed is shown on the bottom of each figure. All experiments were performed at 1 Hz and 37 °C. n = 6 non-failing for ktrs at both Lopt and L90. n = 7 failing for ktrs at Lopt and n = 8 failing for ktrs at L90.

