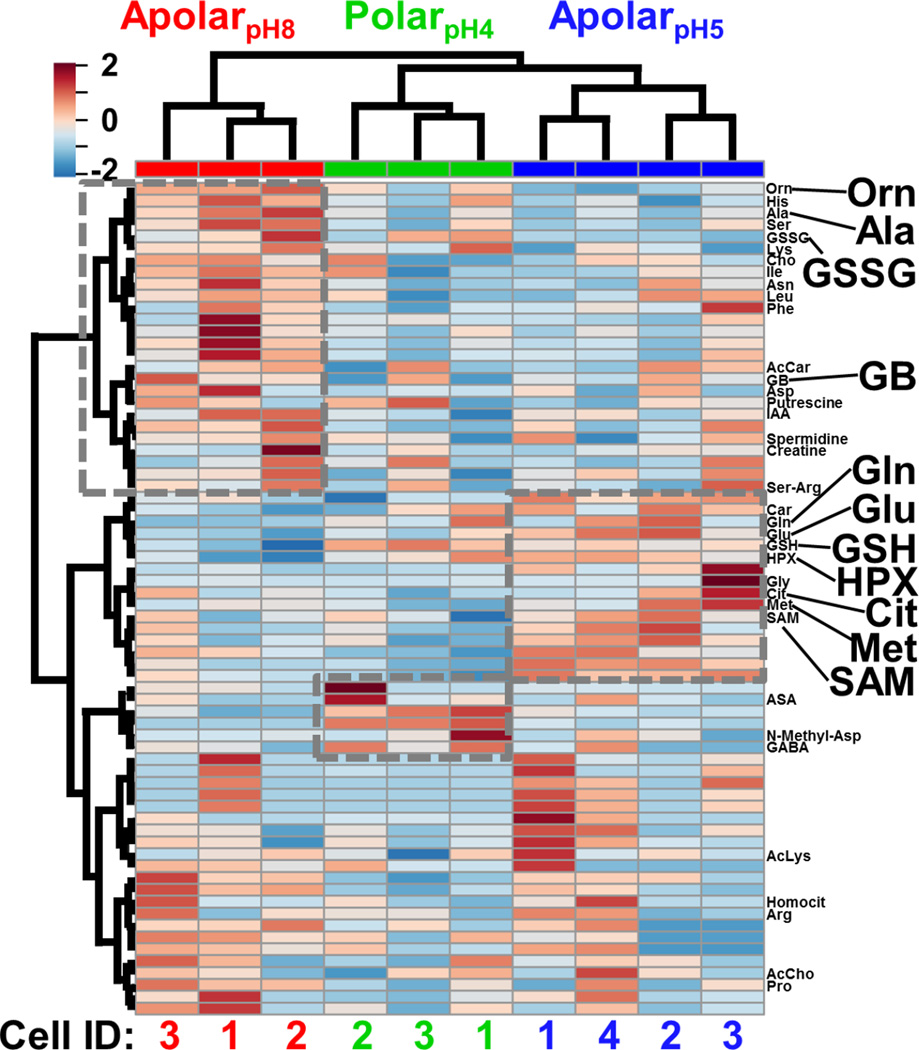
Figure 3.
HCA-heat map identifying differential metabolite extraction from single D1R blastomeres using the 3 solvents. The plot was calculated for the 70 most statistically significant differences. Individual blastomeres with unique cell identifiers (Cell ID) are shown on the horizontal axis (see bottom axis). Different molecular features are shown on the vertical axis (see right axis). Dashed boxes exemplify quantitative chemical differences between the extracts. Metabolites with statistically significant differences in abundance based on Fisher’s LSD are labeled (see also Table S3). Metabolites are shown in three-letter codes. Key: Cit, citrulline; GB, glycine betaine. Molecular features that have yet to be identified are not shown (see all labels in Fig. S2).

