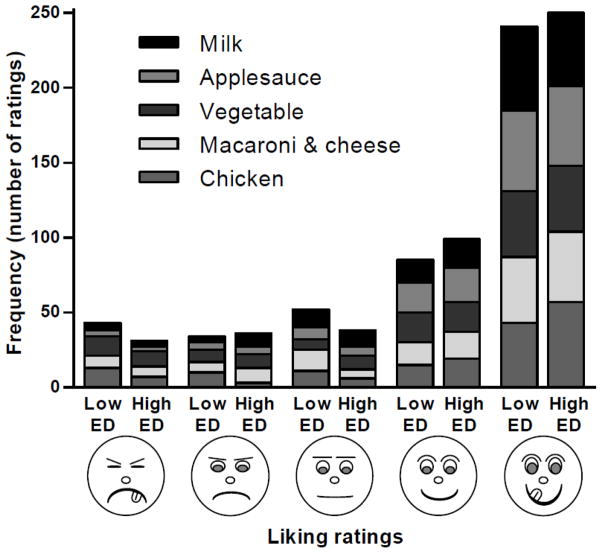
Figure 3.
Frequency distribution of liking ratings (faces from left to right represent “super yucky,” “yucky,” “just okay,” “yummy,” and “super yummy”) for the lower- and higher-energy dense versions of a meal consisting of chicken, macaroni and cheese, green vegetable, applesauce, and milk. There was no significant difference in distribution of the ratings between the two versions of the meal, according to ordinal repeated measures logistic regression (p=0.15). ED, energy density.

