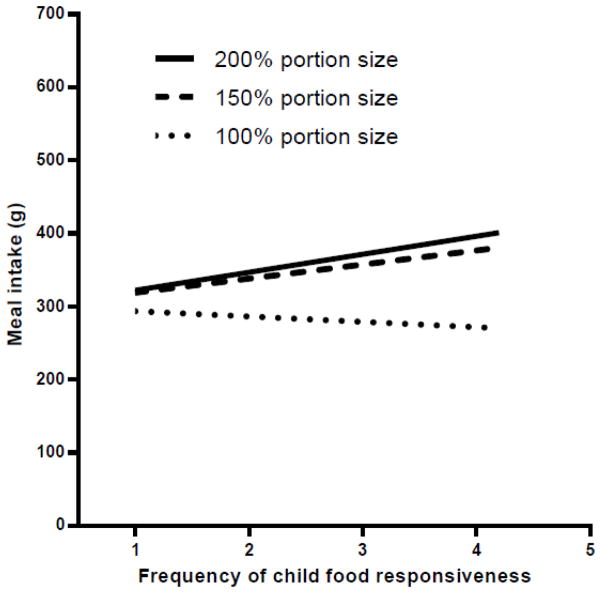
Figure 4.
Effect of parental ratings of child food responsiveness on the relationship between meal portion size and weight of the meal consumed. Scores on the food responsiveness scale indicate the mean frequency of 5 responsive behaviors and range from 1 (never) to 5 (always). Analysis of covariance showed that the slopes of the regression lines for the 150% and 200% portion conditions were significantly greater than the slope for the 100% condition (both P<0.01). Thus, children who were rated as being more responsive to food had larger increases in intake when served the 150% and 200% portions of the meal (compared to the 100% condition) than children who were less responsive.

