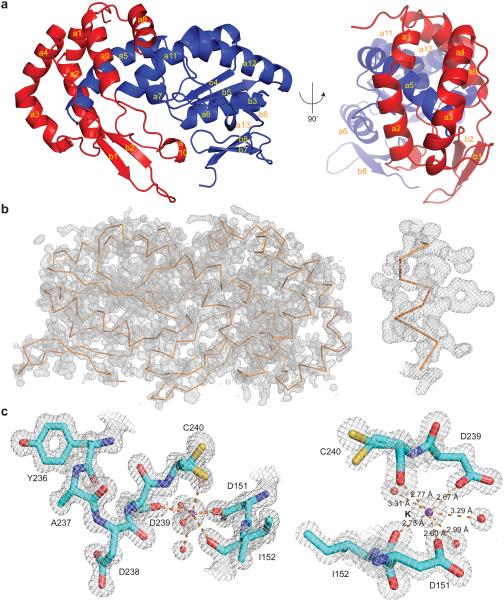
Figure 1. Overall structure and active site of the R.i. RT domain.
(a) Cartoon diagram of the R.i. RT domain in two views. The finger subdomain is shown in blue and the thumb subdomain is shown in red. The α-helices (a1–a13) and β-sheets (b1–b8) are labeled in yellow. (b) Experimental map of the R.i. RT domain. The backbone of R.i. RT is shown as a ribbon diagram in orange. To illustrate the quality of the map, a close-up view of an α-helix (residues 109–118) is shown on the right. The experimental map is contoured at the 1.5σ level. (c) The active site of the R.i. RT domain. The protein residues are shown as sticks where cyan represents carbon, red represents oxygen, blue represents nitrogen and yellow represents sulfur. The waters are shown as red spheres and the potassium ion is shown as a purple sphere. The interactions involving the potassium ion are shown as orange dashes with indicated distances on the right (estimated coordinate error from phenix.refine is 0.09 Å). Residue C240 is modeled as two conformations, both of which were evident from the map. The 2Fo–Fc map is contoured at the 1.5σ level.

