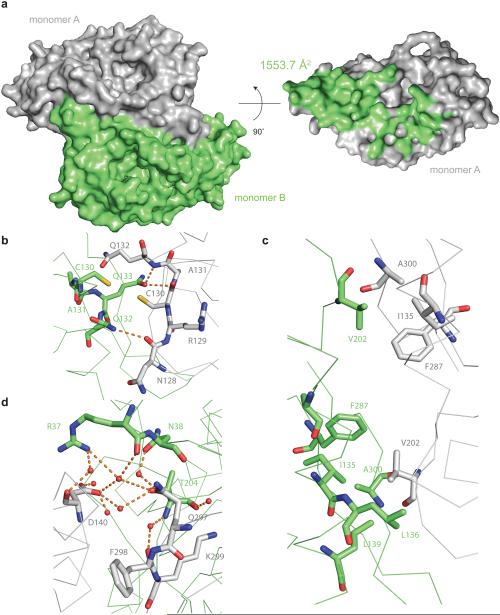
Figure 4. Dimerization interface of the R.i. RT domain.
(a) Surface representation of the RT dimer. On the left panel, the two monomers are colored in grey and green respectively. On the right panel, only monomer A is displayed, and the residues interacting with monomer B are colored in green. (b–d) Representative interactions at the dimer interface. Residues in monomer A are colored in green and residues in monomer B are colored in grey. Residues directly involved in the interactions are shown as sticks, and the backbone is shown as a ribbon diagram. Waters are shown as red spheres. The carbon atoms are colored grey in monomer A and green in monomer B. In both monomers, oxygen is colored in red, nitrogen is colored in blue and sulfur is colored in yellow. Hydrogen bonds are indicated by orange dashes. (b) Two cysteines at the dimer interface. (c) Two hydrophobic patches at the dimer interface. (d) Water mediated hydrogen bond network at the dimer interface.

