
Figure 3.
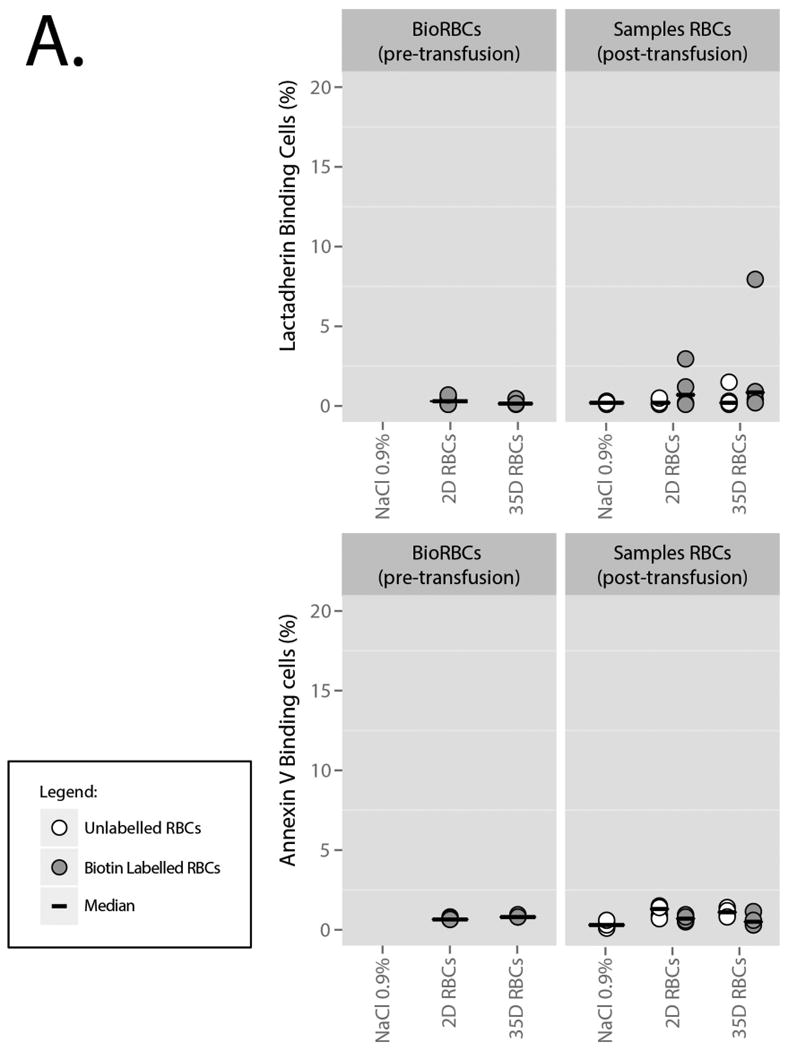
A. PS-exposure, measured by annexin V and lactadherin staining. The grey dots represent biotin labelled cells. The white dots represent untransfused and unlabeled cells in full blood samples from which the BioRBCs were extracted. Bars represent medians.
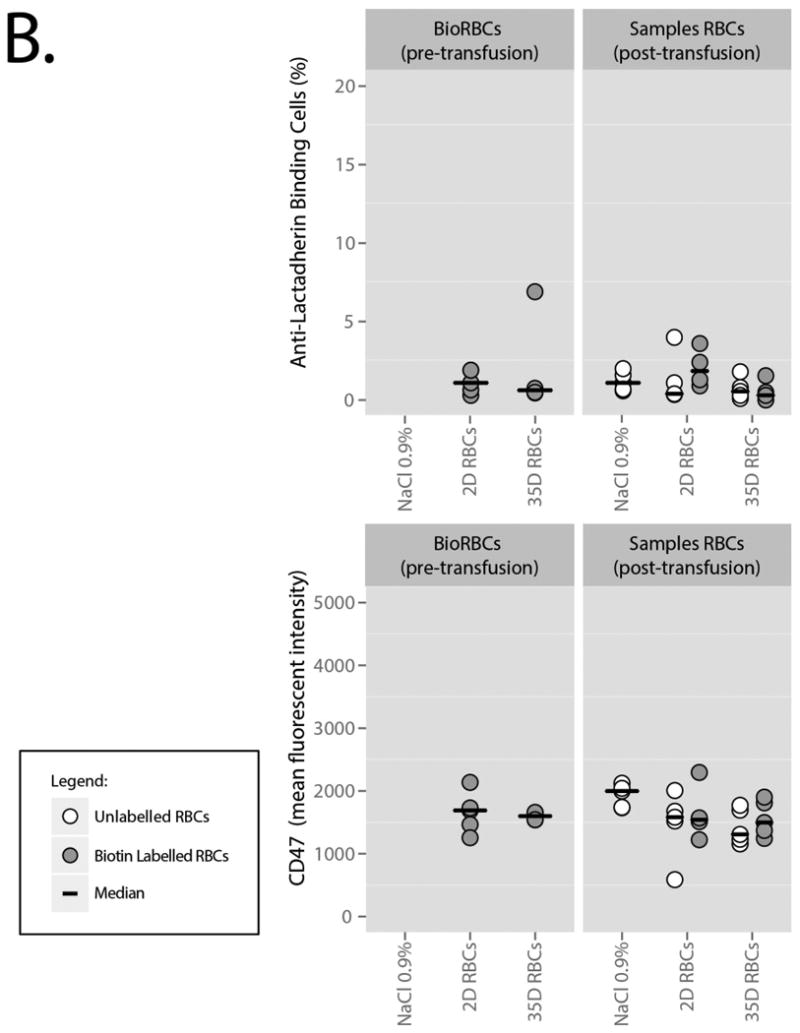
B. Lactadherin binding and CD47 expression. The grey dots represent Biotin Labelled cells. The white dots represent untransfused and unlabeled cells in full blood samples from which the BioRBCs were extracted. Bars represent medians.