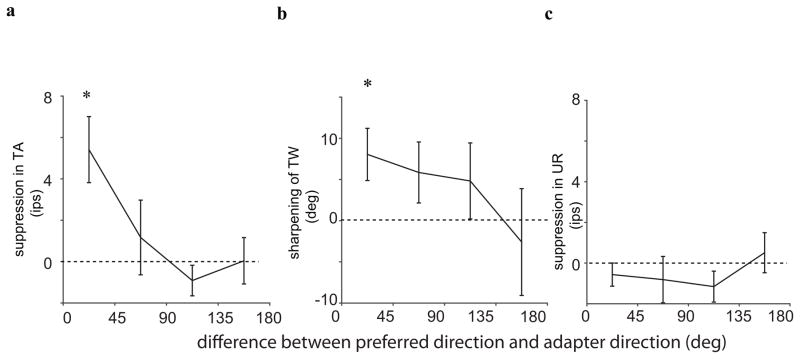
Figure 3.
Average direction-selective adaptation-induced changes. (a) Average change in tuning amplitude with adaptation. On average, TA was suppressed by adaptation, and this effect was largest when the adapter moved in the (near) preferred direction. (b) Average change in tuning width with adaptation. On average, TW were sharper after adaptation. This effect was also largest for adapters near the preferred direction. ((c) Average adaptation-induced changes in untuned responses. On average, there was no significant change in the untuned response.

